What Is Market Cap and Why Does It Matter?

Updated on 3 August 2026
Market cap (market capitalisation) of a cryptocurrency is its unit price multiplied by the number of tokens in circulation. A $0.50 token can therefore be worth more than a $2,000 token if its circulating supply is much larger. This article explains how to calculate it and use it to compare cryptocurrencies.

- Four categories exist based on market cap: large-cap, mid-cap, small-cap and micro-cap, with risk increasing as the cap gets smaller.
- Market cap ignores an asset's real liquidity: very low daily trading volume can distort the reading of an apparently high market cap.
- Fully diluted valuation (FDV), which factors in tokens not yet issued, complements market cap to anticipate future dilution risk.
- Low-cap cryptocurrencies are more exposed to market manipulation such as pump and dump or wash trading.
- Unlike a company, crypto market cap does not account for debt or assets held, only tokens in circulation.
What Is Market Cap?
Definition of Market Cap
Market cap, or market capitalisation, represents the total market value of a cryptocurrency. It is calculated by multiplying a token's current price by the total number of tokens in circulation. This metric makes it possible to quickly gauge a cryptocurrency's importance within the broader ecosystem.
Why Market Cap Matters for Cryptocurrencies
Market cap plays a crucial role in evaluating cryptocurrencies by giving a sense of their relative size and adoption. A high market cap, such as Bitcoin's, which reaches around $1.28 trillion (CoinMarketCap, 3 August 2026), generally suggests greater stability and better resistance to market manipulation.
Market cap also influences an asset's liquidity. The larger it is, the easier it is to buy or sell without significantly affecting the price.
Traditional vs Crypto Market Cap
Cryptocurrency market cap differs from that of traditional stocks in its more dynamic and volatile nature. In the crypto world, the number of tokens in circulation can vary considerably depending on burning, minting or staking mechanisms, which directly affects market cap.
Unlike stocks, where enterprise value factors in debt and assets, crypto market cap focuses solely on the market value of tokens in circulation. This can sometimes give an incomplete picture of a project's real value.
with full confidence
Investing carries risks, including a risk of capital loss. Crypto-assets are highly volatile assets: you may lose all or part of your investment. Past performance is not a reliable indicator of future performance. Finary is authorised as a Crypto-Asset Service Provider (CASP) by the AMF under the MiCA regime.
How to Calculate Market Cap?
Understanding the Formula
Calculating market cap is remarkably simple. Just multiply a token's current price by the total number of tokens in circulation. For example, if a cryptocurrency is worth $10 and has 1 million tokens in circulation, its market cap will be $10 million. This formula applies uniformly to every cryptocurrency, whether Bitcoin or a brand-new token.
A Worked Example With Bitcoin
Let's take Bitcoin as a concrete example. For illustration, with a price of around $63,750 and a circulating supply of about 20.07 million BTC (CoinMarketCap, 3 August 2026), its market cap reaches roughly $1.28 trillion.
By comparison, Ethereum, with a price of around $1,865 and a circulating supply of about 120.7 million tokens, has a market cap of roughly $225 billion (CoinMarketCap, 3 August 2026). This significant gap perfectly illustrates why unit price alone is not enough to gauge a cryptocurrency's relative importance. Despite a unit price far lower than Bitcoin's, Ethereum remains the second-largest cryptocurrency by market cap.
How to Classify Cryptocurrencies by Market Cap?
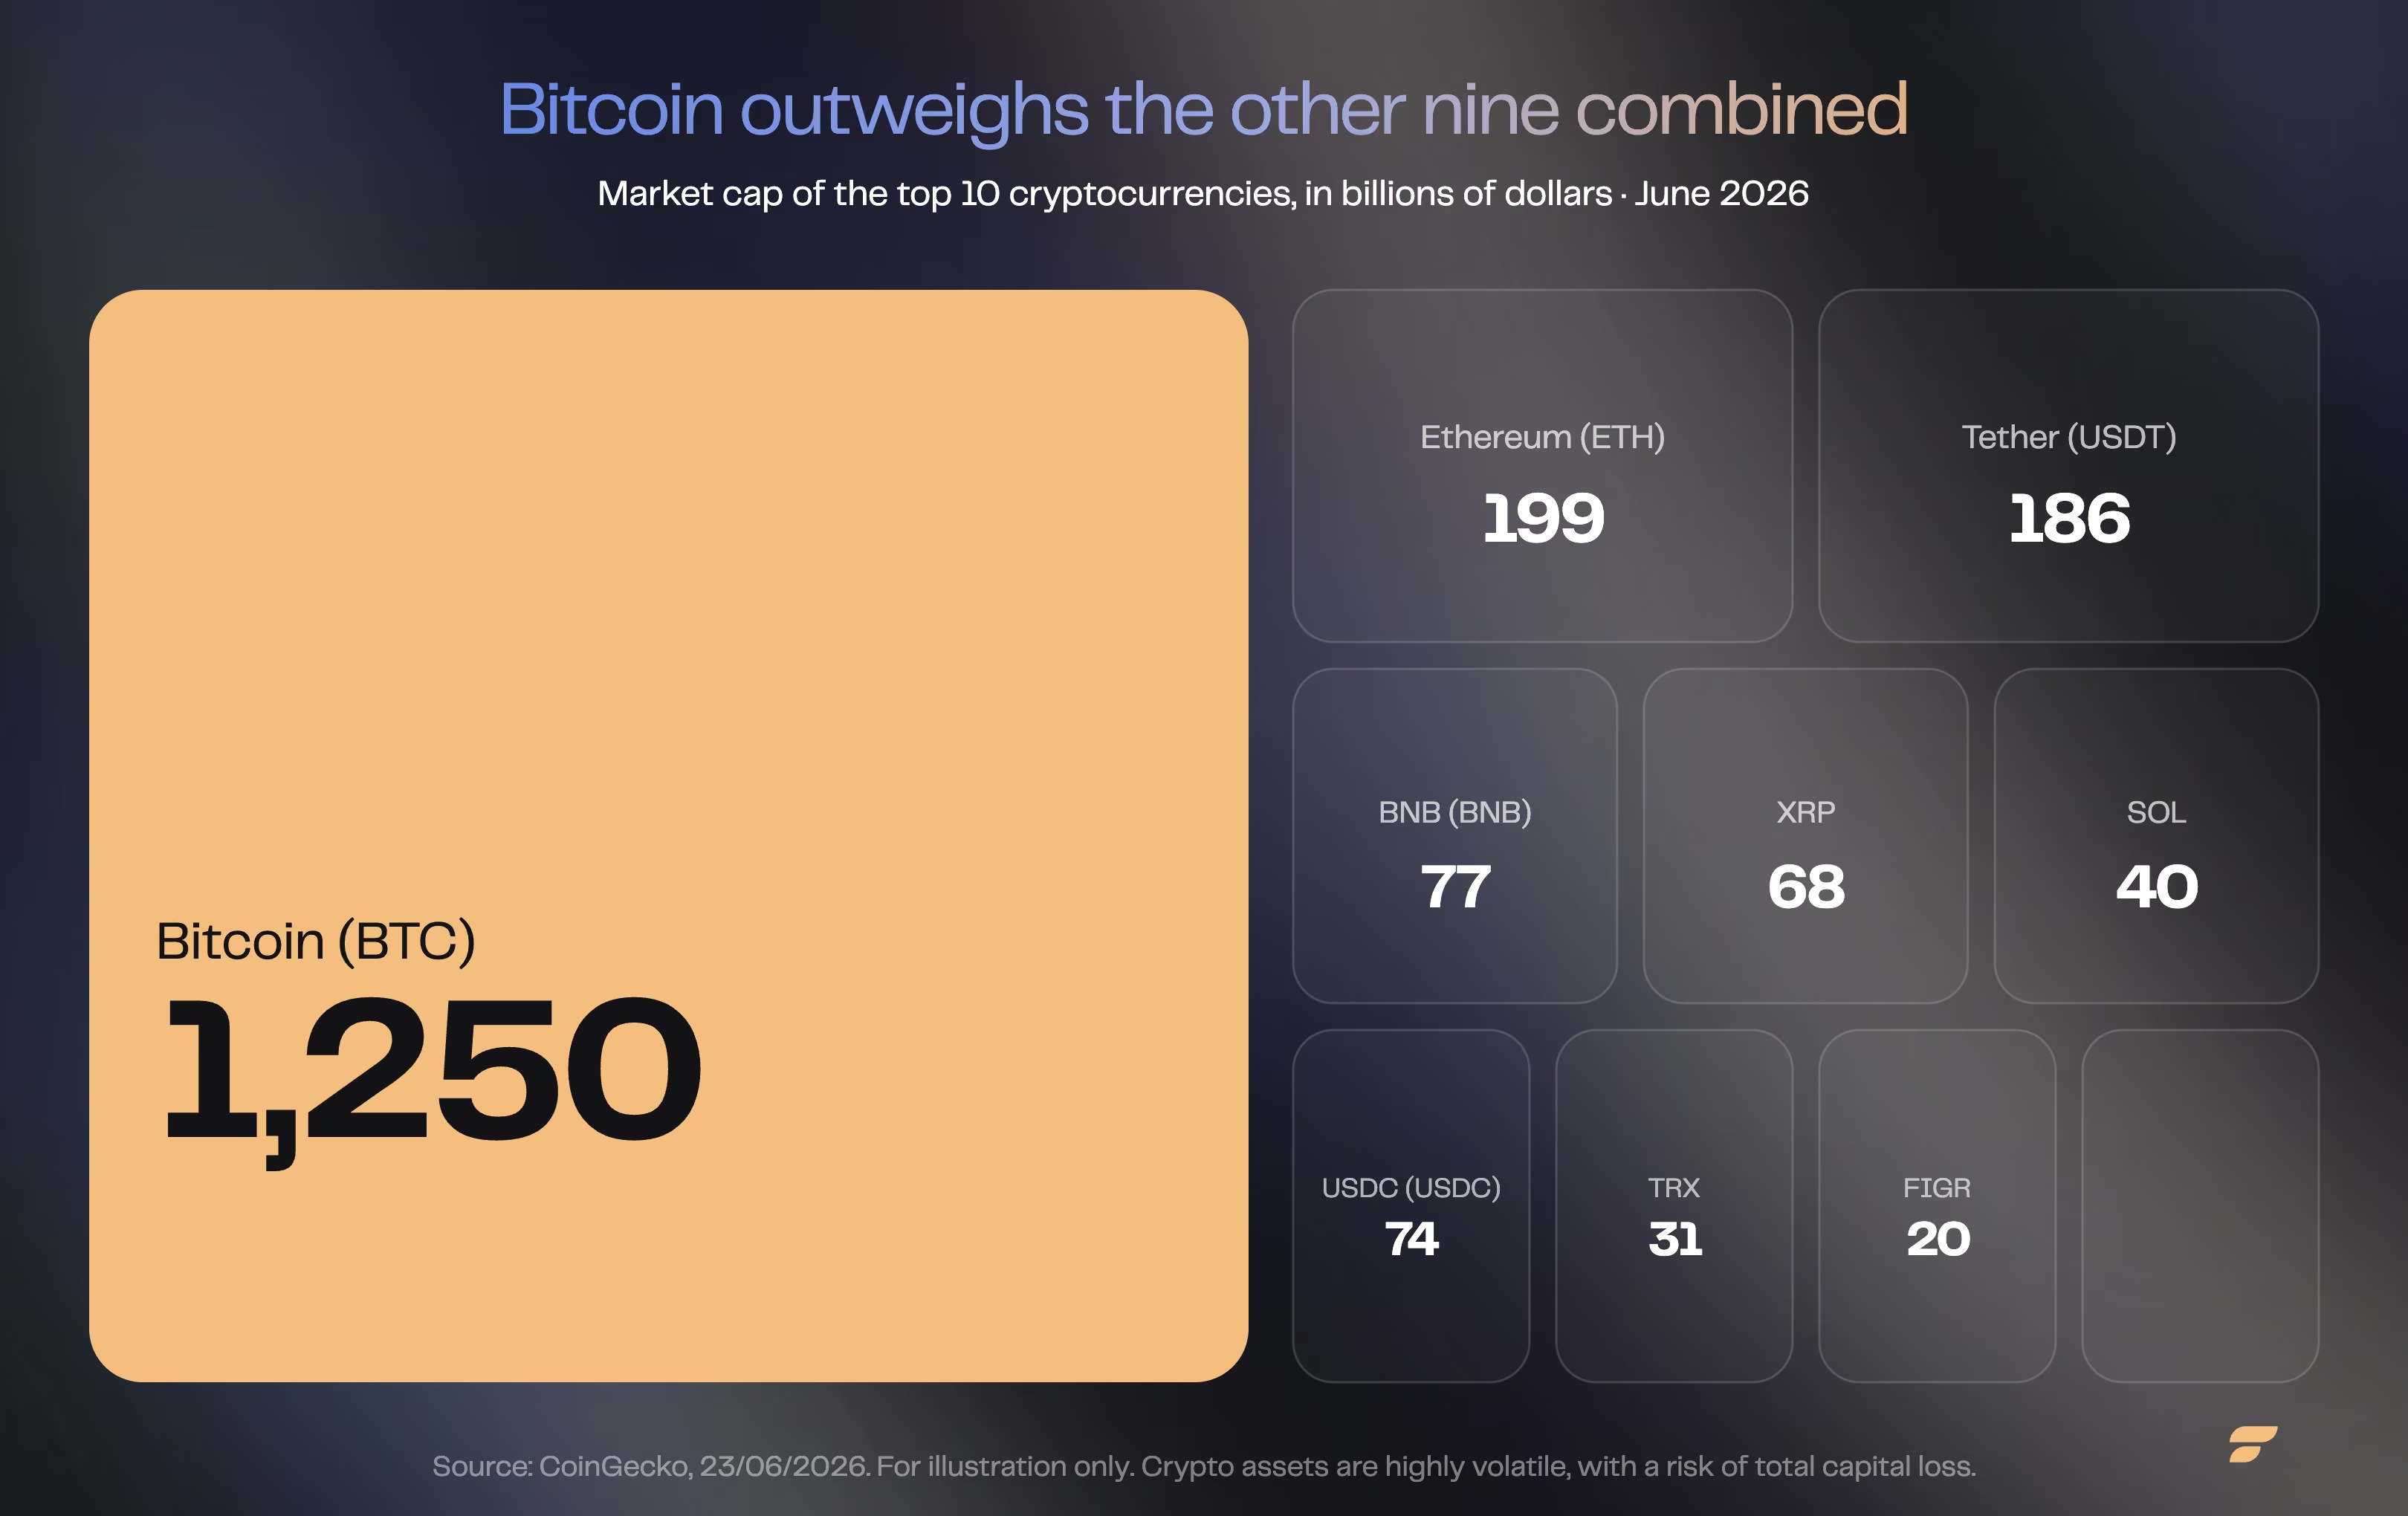
Cryptocurrencies fall into four categories based on market cap: large-cap (more than $10 billion), mid-cap ($2 billion to $10 billion), small-cap ($300 million to $2 billion) and micro-cap (less than $300 million), each tier corresponding to a distinct risk profile.
Large-Cap, Mid-Cap, Small-Cap and Micro-Cap
| Category | Market Cap | Risk Profile | Examples |
|---|---|---|---|
| Large-cap | More than $10B | Established, high liquidity, lower volatility | Bitcoin, Ethereum, Tether |
| Mid-cap | $2B to $10B | Balance of stability and growth | Avalanche, Chainlink |
| Small-cap | $300M to $2B | Speculative, high potential and high risk | Many recent altcoins |
| Micro-cap | Less than $300M | Highly speculative, risk of total loss | Basic Attention Token |
Large-cap cryptocurrencies exceed $10 billion. These assets are the most established in the market, generally seen as relatively less volatile, though not free of capital-loss risk. Bitcoin dominates by far with roughly $1.28 trillion (CoinMarketCap, 3 August 2026), ahead of Ethereum, the market's second-largest by market cap. This tier also includes major stablecoins such as Tether (around $183 billion) and major platforms such as BNB (around $78 billion) or XRP (around $68 billion).
Mid-cap cryptocurrencies, ranging between $2 billion and $10 billion, offer a balance between risk and growth potential. Projects such as Avalanche or Chainlink illustrate this category: already proven, yet with meaningful room left to grow.
Small-cap ($300 million to $2 billion) and micro-cap (less than $300 million) cover most of the market's most speculative altcoins. Less well known and less liquid, their value can soar or collapse. These categories attract investors chasing potentially high returns, but they also carry the biggest risks, up to a total loss.
Want to deepen your understanding of crypto investing? Check out our complete guide to investing in crypto. Reminder: investing in crypto-assets carries a high risk of capital loss.
How to Use Market Cap to Evaluate a Cryptocurrency?
Market cap makes it possible to objectively compare the size of two cryptocurrencies, regardless of their unit price, and to anticipate how large a price move would need to be to significantly change its value.
Using Market Cap for Evaluation
Market cap is an essential tool for objectively comparing different cryptocurrencies, regardless of their unit price.
For example, a crypto priced at $1 with 1 billion tokens in circulation (a $1 billion market cap) carries more weight in the ecosystem than a crypto priced at $100 with 1 million tokens (a $100 million market cap). This metric makes it possible to compare projects' relative size, independent of unit price, which can be misleading on its own.
Investment decisions are often based on market cap to assess a project's growth potential. A low-cap crypto can see bigger price swings, both up and down, than one that is already heavily capitalised.
For example, for a crypto with a $1 million market cap to double in value, it only needs an inflow of $1 million, whereas Bitcoin would need close to $1.28 trillion for the same result.
How Market Events Affect Market Cap
Crypto market volatility can trigger dramatic swings in market cap within a very short time. During the 2021 bull market, the total crypto market cap more than tripled within a few months, rising from $750 billion in January to more than $2.5 trillion by May (CoinDesk). These rapid moves show why tracking market cap changes matters for understanding market trends.
Major crises, such as the FTX collapse in 2022, can trigger sharp market-wide drops in market cap. According to CoinDesk, the total crypto market cap fell below $800 billion in mid-November 2022, a loss of around 20% within days, its lowest level since early 2021. These swings show how market cap reflects not only projects' intrinsic value but also overall market sentiment and investor confidence.
at your own pace
Investing carries risks, including a risk of capital loss. Crypto-assets are highly volatile assets: you may lose all or part of your investment. Past performance is not a reliable indicator of future performance. Finary is authorised as a Crypto-Asset Service Provider (CASP) by the AMF under the MiCA regime.
Limitations and Considerations of Market Cap
Limitations of Market Cap
Despite its usefulness, market cap does not always accurately reflect a cryptocurrency's real health. It does not account for the market's actual liquidity. A crypto can have a large market cap but very low trading volume, making it hard to buy or sell large quantities without significantly moving the price.
Governance structure, a project's technical quality and its real-world adoption are also crucial factors this metric ignores.
Other Metrics to Consider Alongside Market Cap
Daily trading volume is an essential complement to market cap, since it indicates a cryptocurrency's real activity and liquidity. For example, a crypto with a $1 billion market cap but a daily volume of only $10,000 carries significant liquidity risk.
Other useful metrics include:
- Circulating supply.
- Market dominance ratio (percentage of total market cap).
These metrics shed light on a crypto's distribution and relative importance.
Warnings About Possible Manipulation
Market cap manipulation can take various forms, notably "pump and dump". In this scenario, actors artificially coordinate a price rise before selling off en masse. "Wash trading", which involves simultaneously buying and selling to artificially inflate trading volume, is another common practice.
This kind of manipulation is especially common with low-cap cryptocurrencies. Even a small group of actors can significantly influence the price.
To detect this kind of manipulation, it is crucial to analyse anomalies in trading volumes and price movements. A sudden rise in market cap with no underlying fundamentals, or unusual activity on social media, can signal manipulation under way. Savvy investors also watch holder concentration. A high concentration in a few wallets raises the risk of manipulation.
Case Studies and Practical Examples
Case Study: Bitcoin and Ethereum
Bitcoin dominates the cryptocurrency market with a market cap of around $1.28 trillion. It accounts for roughly 59% of the total market cap (CoinMarketCap, 3 August 2026).
This historic dominance reflects its status as the first cryptocurrency and its perception by part of the market as a digital store of value, a label that remains debated. Ethereum, with a market cap of around $225 billion (CoinMarketCap, 3 August 2026), holds a solid second place thanks to its decentralised finance (DeFi) ecosystem and blockchain applications.
The evolution of their respective market caps tells a fascinating story. In 2020, Ethereum's market cap was only 12% of Bitcoin's. Today, that ratio has risen to around 17.6% (CoinMarketCap, 3 August 2026), reflecting Ethereum's growing strength thanks to its rising adoption in Web3 and DeFi (past performance is not a reliable indicator of future performance).
This progression shows how market cap can reflect the evolution of a cryptocurrency's usefulness and adoption.
Example of a Mid-Cap Cryptocurrency
Mid-cap cryptocurrencies show particularly interesting dynamics. Take Near Protocol, with a market cap of around $2.27 billion (CoinMarketCap, 3 August 2026).
Despite its technology still under development and its announced partnerships, its relatively modest market cap compared with the sector's giants suggests significant growth potential. However, that same trait also makes it more vulnerable to market swings and manipulation.
Emerging projects such as Near Protocol perfectly illustrate the trade-off between risk and return potential. A 100% increase in market cap would require an inflow of "only" $2.27 billion, a considerable but realistic amount within the crypto ecosystem.
Tools and Resources for Tracking Market Cap
Best Platforms for Tracking Market Cap
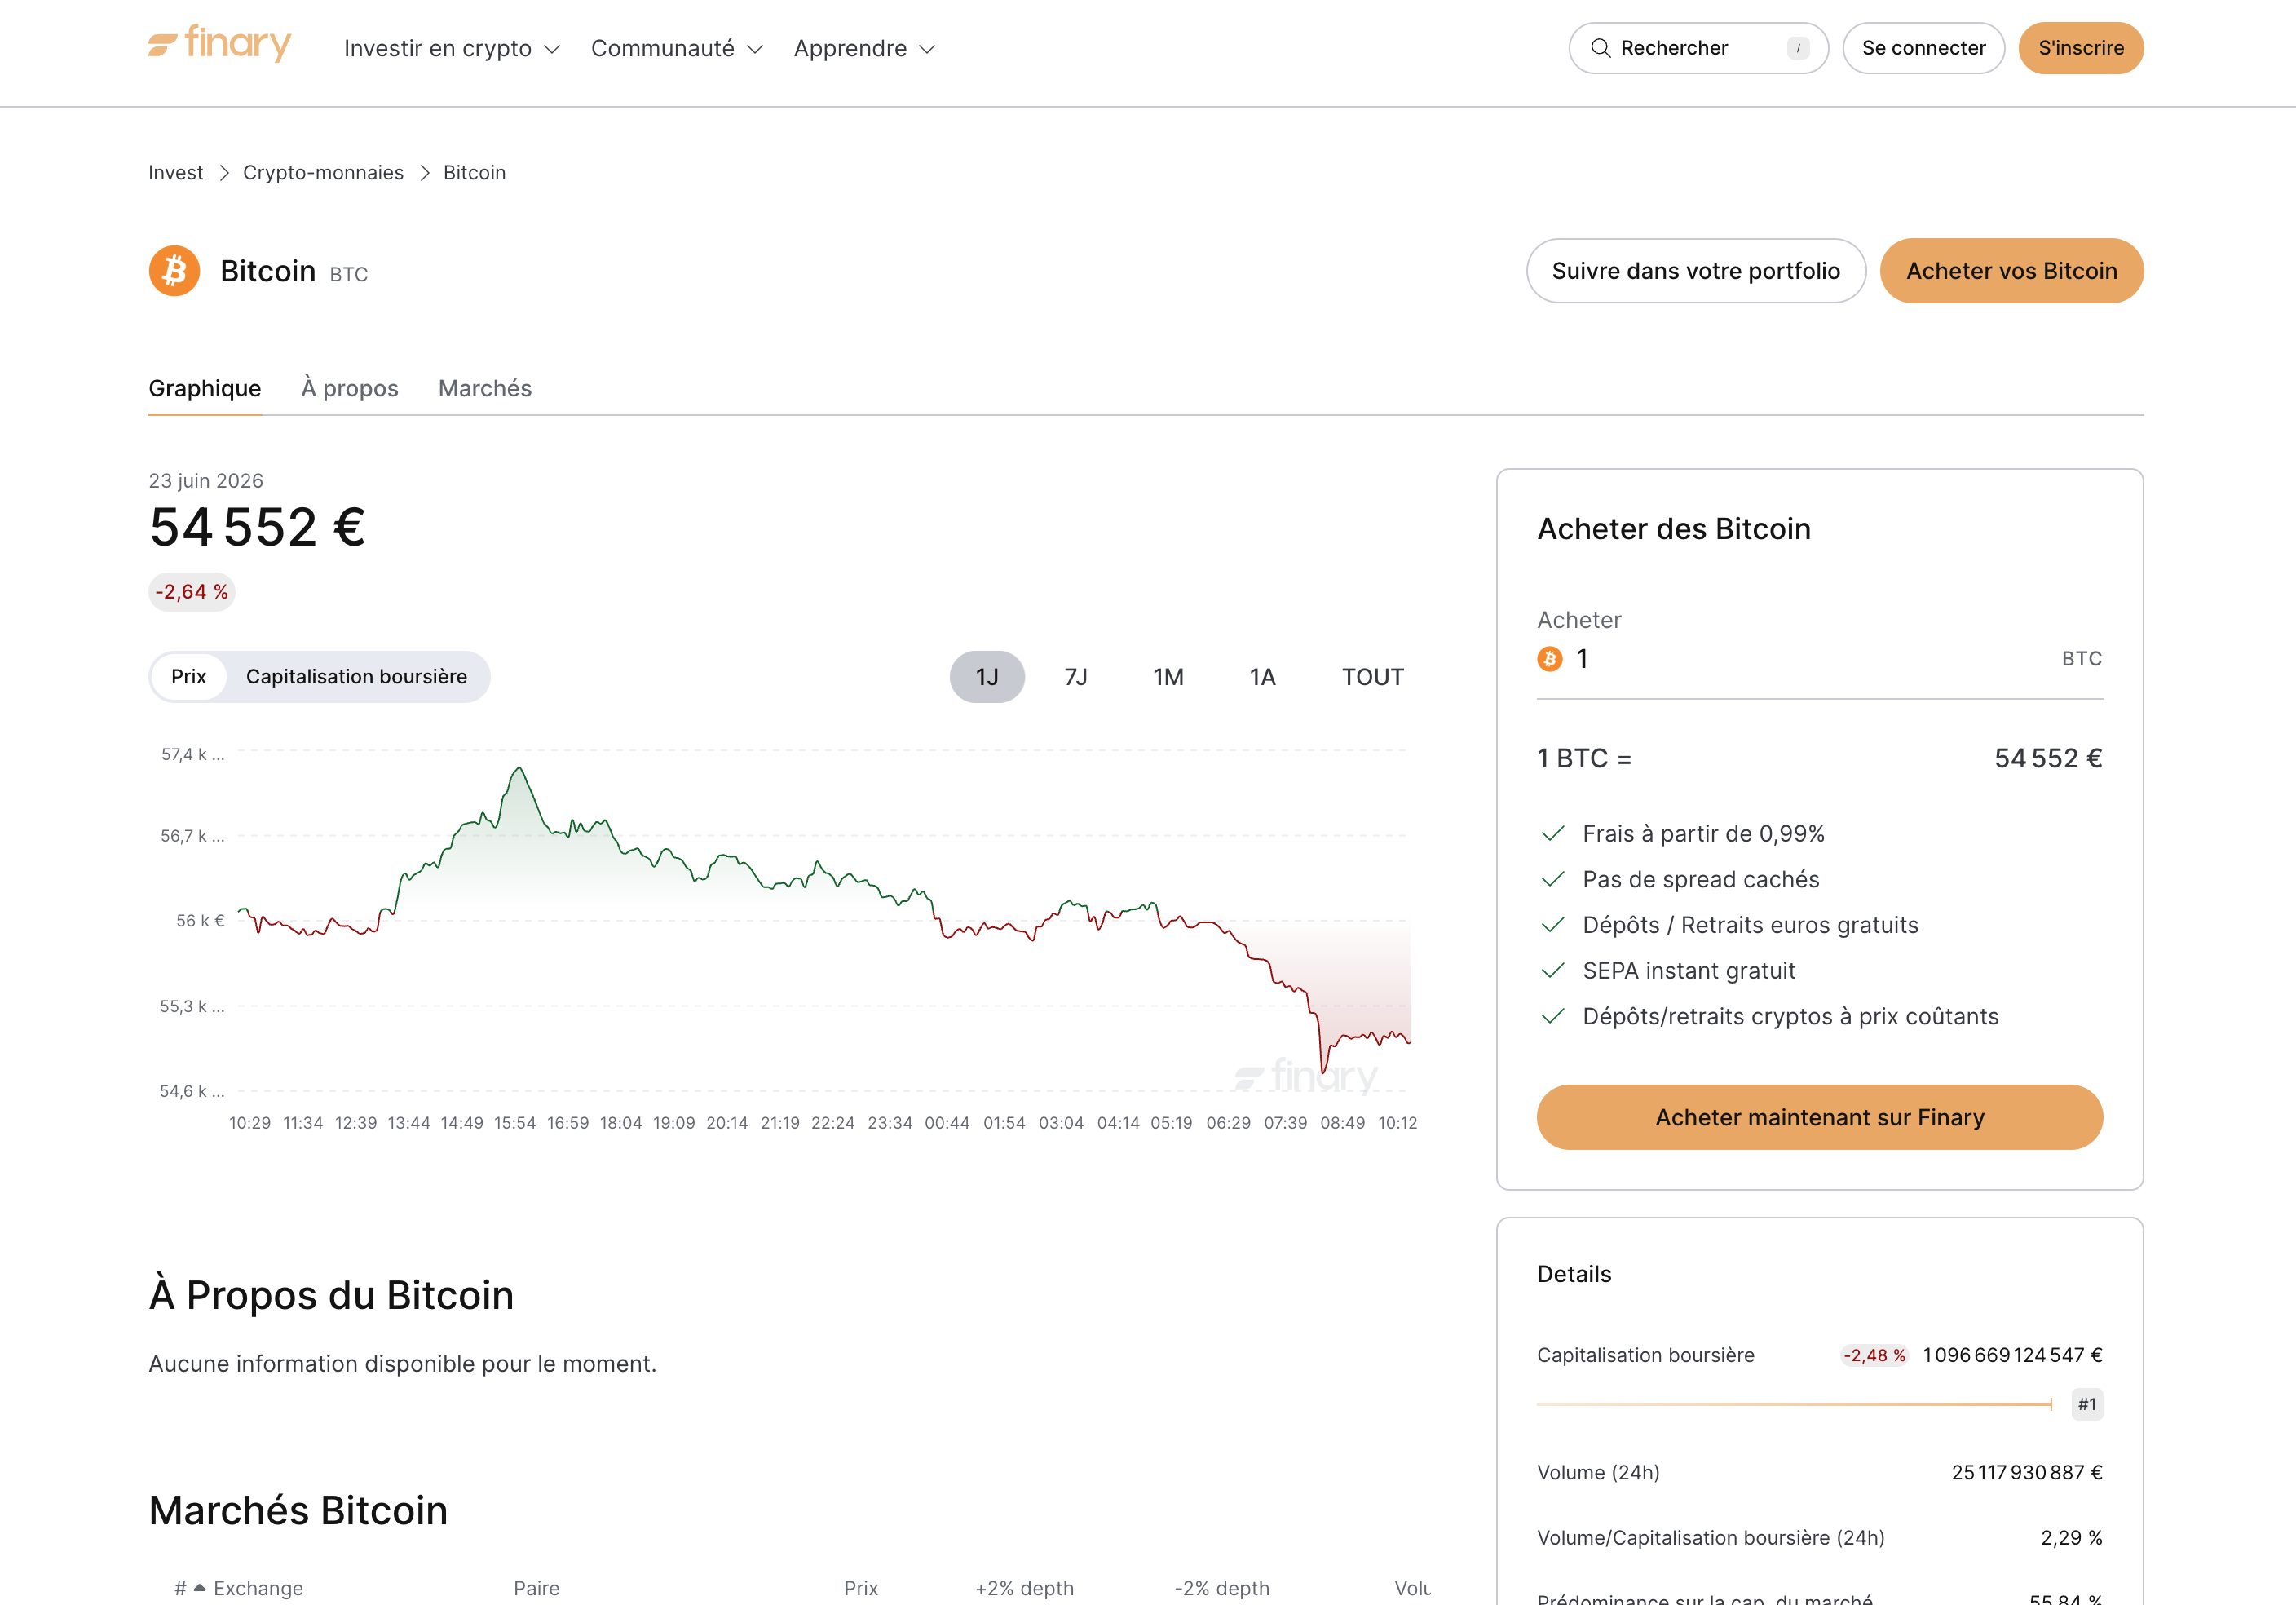
Finary stands out as a complete solution for tracking not just cryptocurrency market caps but an entire investment portfolio. The platform lets you visualise market cap changes in real time while putting them in perspective alongside other asset classes. This holistic approach helps investors keep a balanced allocation within their crypto portfolio.
CoinMarketCap remains the long-standing reference for tracking market caps across the crypto world. The platform provides detailed data on more than 10,000 cryptocurrencies, including their market cap, trading volume and price changes.

Market Cap: A Powerful Indicator, But Never the Only One
Market cap stands out as a fundamental indicator for evaluating and comparing cryptocurrencies. Its real value lies in using it alongside other metrics, such as trading volume and fundamental analysis.
Whether you are a beginner or an experienced investor, understanding market cap and its limits will help you make better-informed decisions in the complex world of cryptocurrencies. Keep in mind that this indicator is only one piece of the puzzle in evaluating a crypto project overall.
If the question is less about a specific project than about crypto's place in your overall wealth strategy, our article on the case for holding crypto within your wealth goes deeper into the topic.
Frequently Asked Questions
Does Market Cap Reflect the Money Actually Invested in a Crypto?
No. Market cap is a theoretical valuation (price multiplied by circulating supply), not the amount actually invested. A small volume of transactions can be enough to push the price up, and therefore the market cap, without any massive inflow of capital.
What Is the Difference Between Market Cap and Fully Diluted Valuation (FDV)?
Market cap is based on the tokens currently in circulation, while FDV (fully diluted valuation) factors in every token that will eventually exist. A large gap between the two signals future supply inflation, and therefore a dilution risk.
Is a Low-Cap Crypto a Good Investment?
A low market cap offers higher upside potential, but also a risk of total loss and strong exposure to manipulation. These assets require thorough research and a high risk tolerance; they are not suited to every profile.
Why Isn't a Token's Price Enough to Judge Its Value?
Price depends on how many tokens have been issued. A crypto priced at $1 with a billion tokens ($1B market cap) carries ten times more weight than a crypto priced at $100 with a million tokens ($100M). Only market cap allows for a fair comparison.
Where Can You Track Cryptocurrency Market Cap in Real Time?
Aggregators such as CoinMarketCap or CoinGecko publish market caps continuously. A wealth-tracking app such as Finary also lets you place your crypto holdings within your overall assets to manage your allocation as a whole.
Sources
CoinMarketCap, cryptocurrency market cap and price data
CoinGecko, market data used for the market cap distribution chart
CoinDesk, on the crypto market crash following the FTX collapse in November 2022
CoinDesk, on crypto market cap crossing the $1 trillion threshold in January 2021
AMF, PSCA whitelist, Finary SAS
Regulatory disclaimers: Marketing communication. Investing carries a risk of partial or total capital loss. Past performance is not a reliable indicator of future performance. This article is provided for information and educational purposes only; it does not constitute personalised investment advice, a buy or sell recommendation, or tax advice. Crypto-assets are highly volatile and carry a risk of total capital loss. They benefit from no capital guarantee and from no deposit-guarantee or investor-compensation scheme. Before investing, read the Key Information Document (KID) and, where relevant, consult an authorised adviser. Finary SAS, an investment firm authorised by the ACPR (no. 19283), member of AMAFI. Insurance broker registered with ORIAS (no. 21001279), member of the CNCGP (association approved by the AMF). Crypto-Asset Service Provider (CASP) authorised by the AMF under the MiCA regime, references no. A2026-026 and no. N2026-008.