Recognizing the end of a bull run: the key signals

Updated on 15 July 2026
A bull run generally nears its end when several signals converge: a massive rotation into speculative altcoins, prolonged RSI overheating, whales withdrawing to exchanges, and widespread media euphoria. Since 2013, these bull cycles have lasted 12 to 18 months on average before turning.

- No single signal guarantees the end of a bull run: the convergence of several technical, on-chain and behavioural indicators is more reliable than any single criterion.
- A drop in Bitcoin dominance below 40% does not systematically signal a market top, as seen in 2021.
- An MVRV ratio above 3.5 (Glassnode) has historically signalled a phase of overvaluation, versus below 1 for undervaluation.
- Bitcoin's bull cycles have lasted 12 to 18 months on average since 2013, though each cycle remains unique and unpredictable.
- Securing profits gradually, through a methodical DCA out rather than an abrupt withdrawal, limits the risk of impulsive decisions at the end of a cycle.
How do crypto market cycles work?
What is a bull run in cryptocurrencies?

The term "bull run" evokes the image of a bull charging upward, a metaphor that captures the energy of rising crypto markets well. A bull run is a phenomenon where collective psychology, technological fundamentals and macroeconomic forces combine.
Crypto bull runs stand out for their intensity. During an upswing, for example, Bitcoin can post gains of 1000% within a few months. This dynamic is driven by the exponential network effect of cryptocurrencies: each new user increases the value of the network, fuelling a virtuous cycle of adoption.
Average length of a historical bull run
Cryptocurrency cycles are unique and do not follow traditional patterns. Since 2013, Bitcoin's major bull runs have generally lasted between 12 and 18 months.
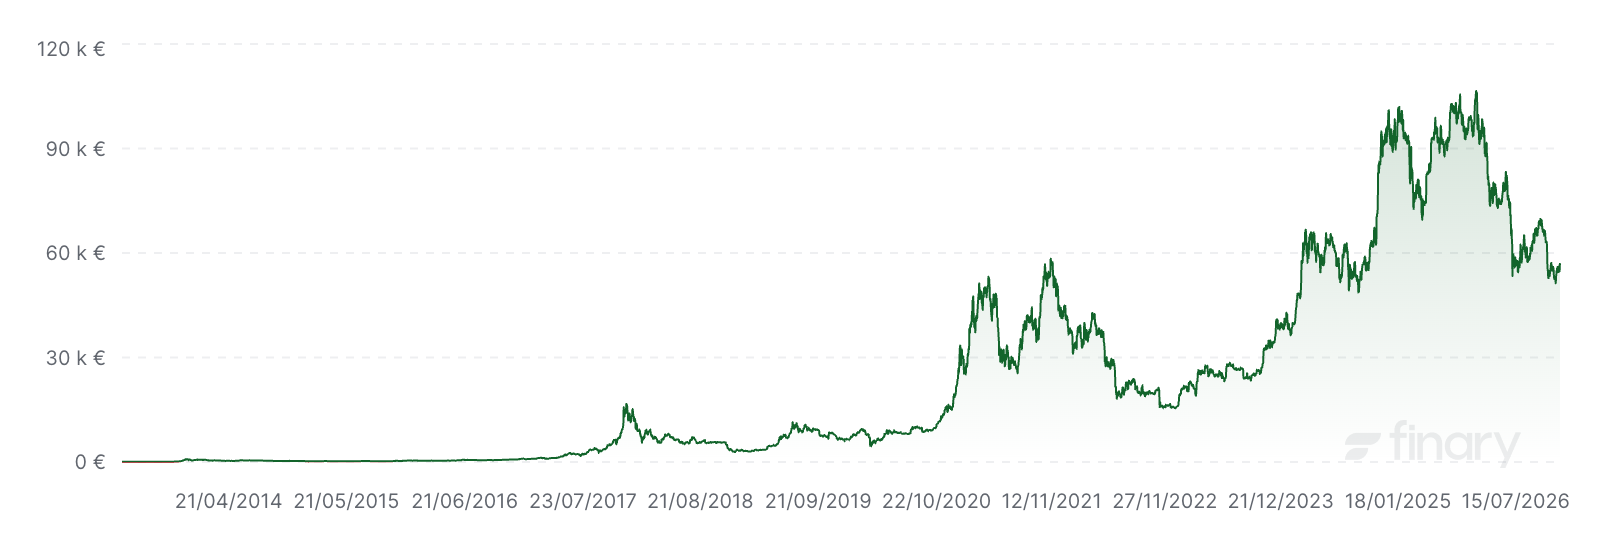
The 2021 market, however, introduced the "double top" phenomenon, showing that the market is becoming more mature and less predictable.
Bitcoin cycles' impact on altcoins
Altcoins have a complex relationship with Bitcoin. Early in a bull run, they tend to follow Bitcoin. During "altcoin season", however, some projects can far outperform it.
Take Ethereum during the 2021 bull run: while Bitcoin more than doubled (roughly ×2.3, from $29,392 to $68,789), Ethereum multiplied nearly sevenfold (from around $730 to $4,878). This asymmetry shows how important it is to understand cycles to succeed in the crypto ecosystem.
Want to dig deeper into the Bitcoin vs Ethereum comparison? Discover their strategic differences and investment potential in our detailed guide.
DeFi projects have enriched these dynamics. Bull runs are no longer limited to price moves; they also drive technological innovation and adoption.
What are the key signals that a bull run is ending?
Market predictions in cryptocurrencies are inherently complex and highly speculative. No analysis can claim to predict the end of a bull run with certainty.
The signals presented below are potential indicators, not guarantees. The crypto market depends on an endless number of dynamic and unpredictable parameters: technological adoption, regulation, investor sentiment, geopolitical events, technological innovations, and many other interconnected factors.
A sudden drop in the Bitcoin Dominance Index
The Bitcoin Dominance Index is an indicator that measures Bitcoin's market capitalisation relative to that of the entire cryptocurrency market.
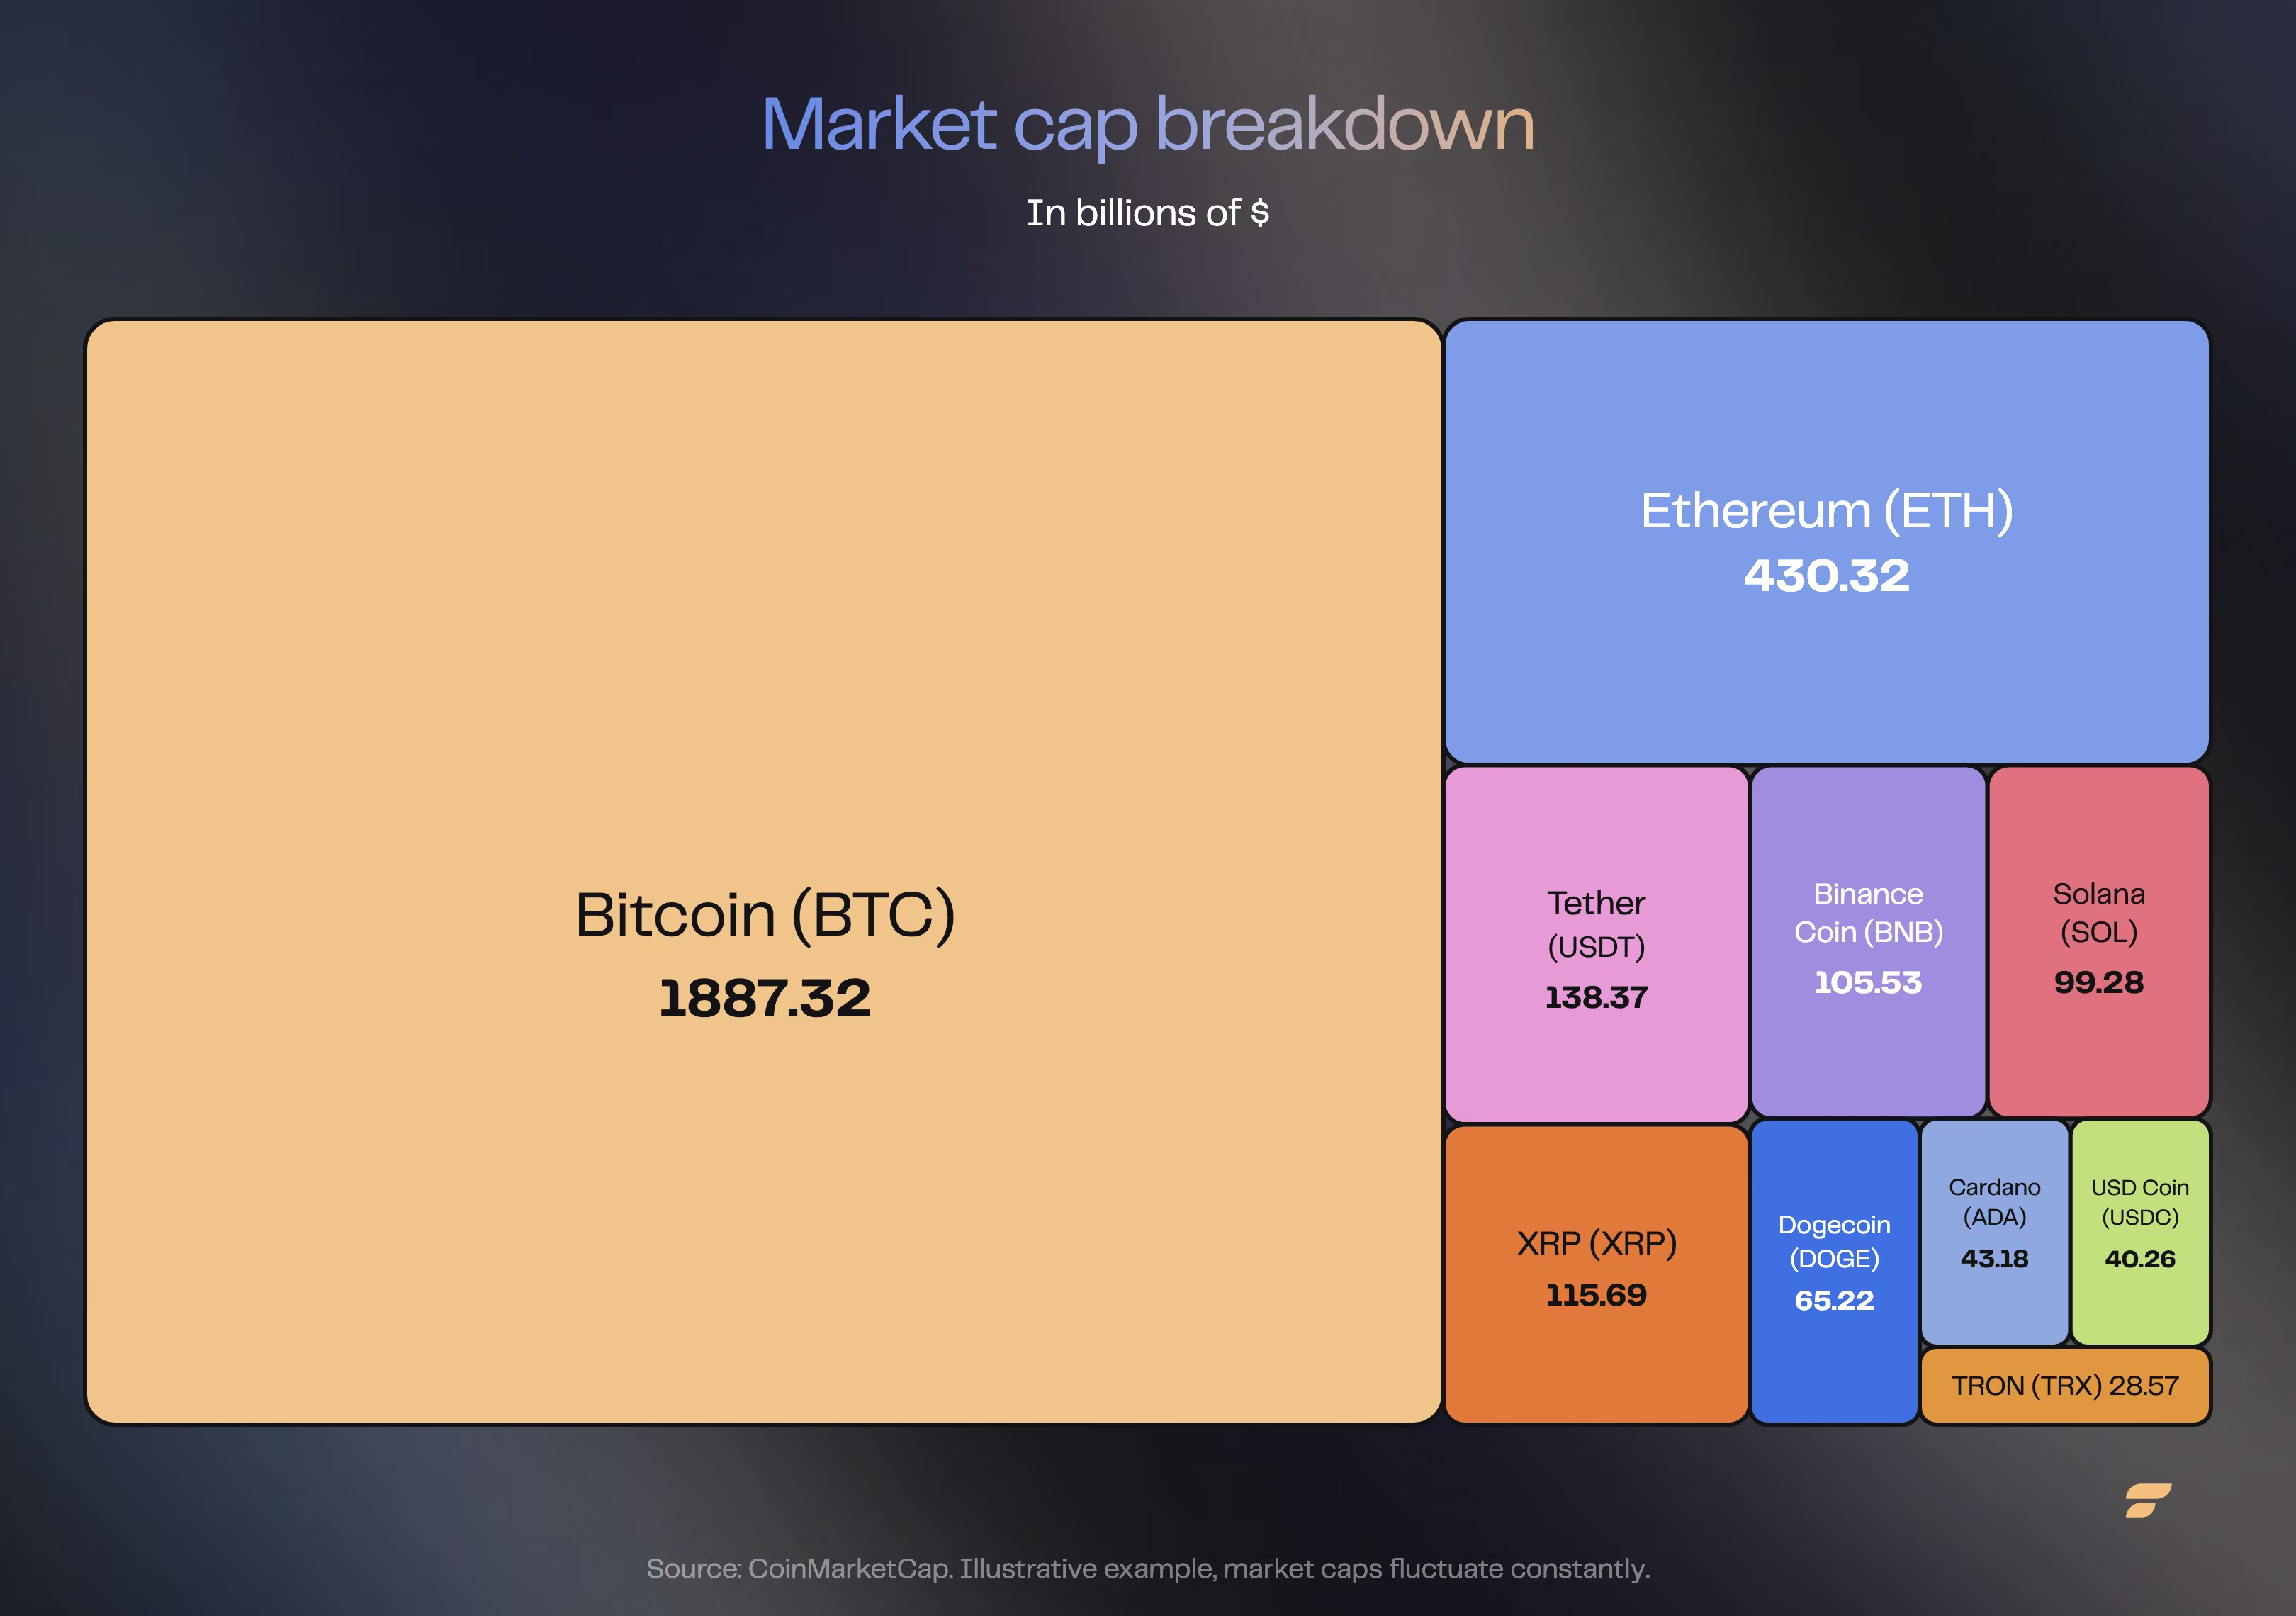
The BDI only tells part of the story. A sharp drop in this indicator does not always signal the end of a bull cycle. During the 2021 bull run, for instance, Bitcoin dominance fell to around 38-40% as early as May 2021 without marking a market top, which only came in November of that same year.
The crucial factor is the correlation with capital flows. If the drop in dominance is accompanied by a rotation into quality altcoins, that suggests a market expansion phase. But if capital flows into dubious projects or "meme coins", that is a warning sign.
A decline in trading volumes on major exchanges
Trading volumes tell a complex story. Beyond the raw figures, the nature of the transactions is what matters. High volume is not always synonymous with market health.
In May 2021, daily volumes on Binance hit record highs during the market crash. According to Chainalysis' analysis, that drop was mainly driven by retail investors selling, with institutional players mostly cutting their purchases rather than selling heavily.
finally regulated
Investing carries risks, including the risk of capital loss. Crypto-assets are highly volatile: you could lose all or part of your investment. Past performance is not a reliable indicator of future performance. Finary is authorised as a Crypto-Asset Service Provider (CASP, "PSCA" in French) under the MiCA regime by the AMF.
A rise in liquidations on futures markets
Mass liquidations can be misleading. In April 2021 (17-18 April), a wave of liquidations topped $10 billion in 24 hours, one of the most violent episodes in crypto market history. That episode coincided with a sudden drop in Bitcoin's hashrate, linked to power cuts in a mining region of Xinjiang, China.
It is crucial to examine the distribution of liquidations rather than their total volume. An abnormal concentration of liquidations on heavily leveraged long positions is particularly concerning.
Technical signals (an overheated RSI, trend breaks)
The RSI (Relative Strength Index) is a technical indicator that measures the speed and magnitude of price changes to assess whether an asset is overbought or oversold. According to Glassnode, the convergence of several technical and on-chain signals remains more reliable than a single indicator for anticipating a market reversal.
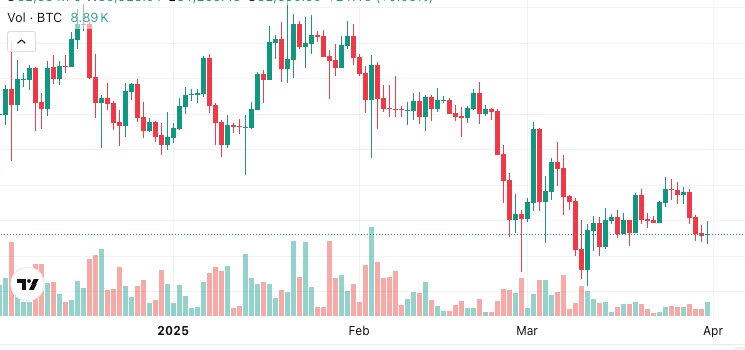
Technical indicators like the RSI take on a new dimension in crypto markets. An RSI of 85 early in a bull run does not mean the same thing as one at the end of a cycle.
The convergence of technical signals is a powerful indicator. The simultaneous presence of a bearish RSI divergence, a break of the 50-day moving-average support, and a "death cross" on the MACD significantly increases the probability of a major reversal.
Whale behaviour and fund movements
Whales are large investors who hold huge amounts of cryptocurrencies. Their actions can influence the market. They can be identified by monitoring large transactions on the blockchain.

Whales use advanced tactics to hide what they are doing. If they are observed sending far more crypto to exchanges (to sell) than to their personal wallets (long-term storage), however, that can be an early warning sign of a market drop within the following month.
Another clue: a rapid build-up of stablecoins on exchanges, combined with falling Bitcoin reserves, often indicates that they are getting ready to cash in their profits.
Strategies for protecting your capital at the end of a cycle
Profit-securing techniques
DCA out, or gradual de-accumulation, calls for a considered strategy rather than simply "selling in tranches". The pace of withdrawals can be adjusted based on observed volatility. Some investors, for example, adapt the frequency of their profit-taking during periods of all-time highs.
Avoid setting arbitrary exit percentages. Adjust your withdrawals based on your total crypto exposure.
If your allocation exceeds your comfort threshold, some investors step up their exits. This flexibility lets you stay invested while gradually reducing your risk.
Reallocating to stablecoins
Stablecoins vary in terms of systemic risk. USDC and USDT, for example, offer greater transparency on their reserves. Concentrating all your stablecoins on a single blockchain, however, increases your exposure to technical risk.
Diversifying stable positions across several cryptos is one approach discussed for reducing this risk. Ethereum is essential for its liquidity, but alternatives such as Polygon or Avalanche can lower transaction fees while offering adequate security. This approach can make it easier to access different ecosystems.
Want to refine your crypto investment strategy further? Discover our detailed advice for buying cryptocurrencies with confidence.
Using smart stop-loss orders
Traditional stop-losses do not account for the intrinsic volatility of crypto. A smart stop-loss adjusts dynamically to market conditions. During periods of high volatility, some traders widen the gap between the price and the stop-loss.
A cascading stop-loss strategy, spreading orders across different levels, is sometimes used. This gradual method aims to limit hasty exits.
Managing emotions amid volatility
Managing emotions is crucial at the end of a cycle. Keeping a trading journal detailing transactions and emotions is a common practice. This practice can reveal unsuspected behavioural biases.
Setting decision rules in advance is a frequently observed approach. For example, do not change your exit strategy while the RSI stays above 70, or keep 20% of your position regardless of market conditions. Rules like these can limit impulsive decisions.
When and how to buy back after a crash
The timing for reinvesting after a crash should be methodical. Build a decision matrix based on several indicators:
- Distance from the all-time high (at least -70%)
- Overall sentiment (extremely negative)
- On-chain fundamentals (accumulation by long-standing addresses)
- Capitulation of mainstream media
A cautious approach is to start with small test positions. If the first entry proves premature, remaining buying capacity stays available for lower levels. This gradual approach allows decisions to be adjusted based on how the market reacts.
Be careful, as the first rebounds can be traps. Periods of marked disinterest in the crypto market have historically been observed as accumulation phases, even when the enthusiasm of people around you for the sector's future seems to fade.
On-chain analysis platforms
On-chain analysis offers valuable insights rarely used by investors. Beyond data such as transaction volume, certain indicators deserve particular attention. The CryptoQuant MVRV ratio (or Glassnode's, which is also widely used), combined with the average age of tokens in motion, reveals behaviour patterns among experienced investors.
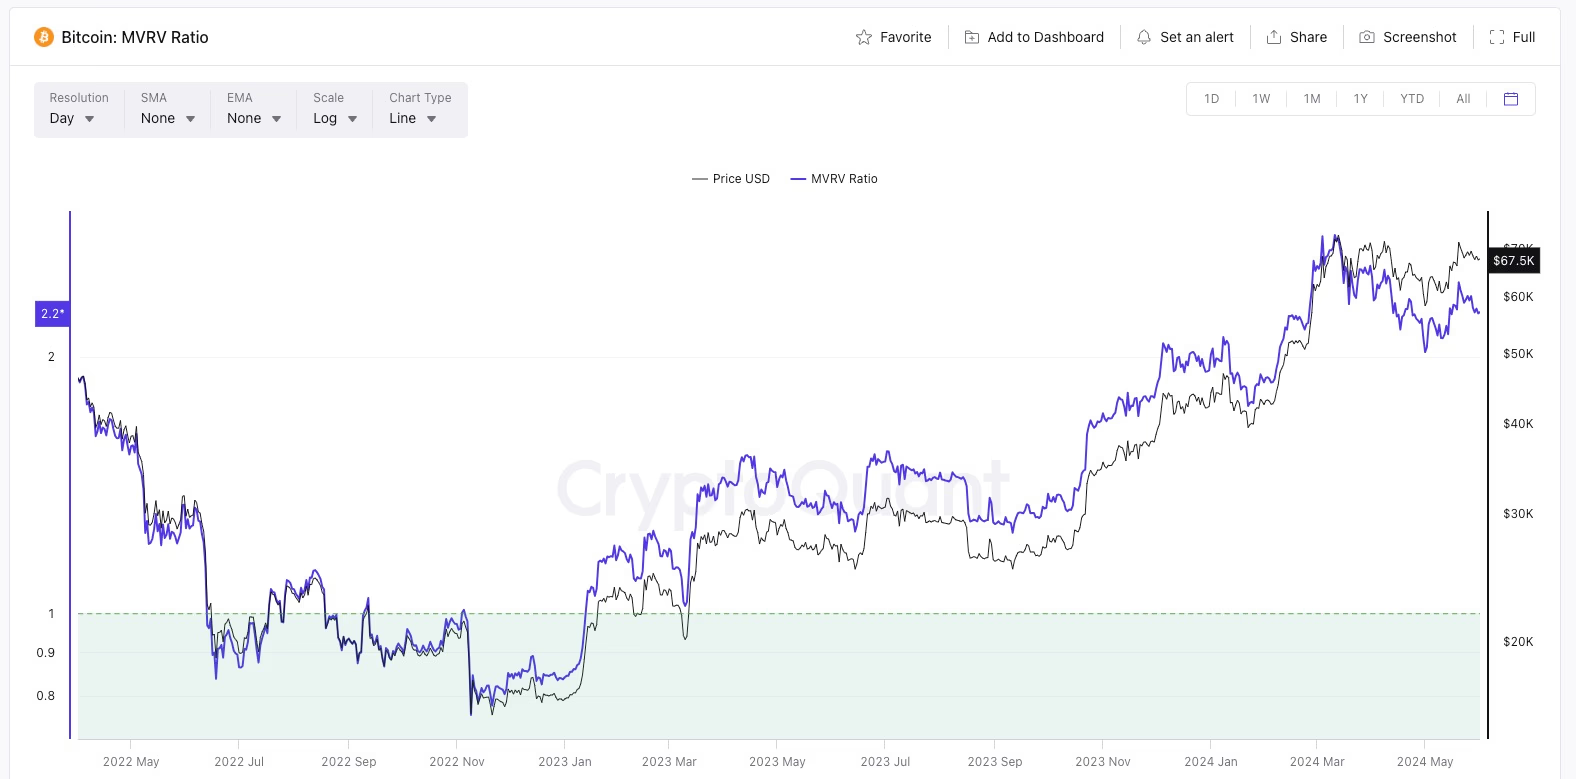
The MVRV (Market Value to Realized Value) ratio compares an asset's current market value to its realised value, which represents the average price at which the tokens were acquired. A high MVRV ratio (above 3.5 according to Glassnode, or 3.7 according to CryptoQuant) has historically been associated with phases of potential overvaluation, and a low ratio (below 1) with phases of potential undervaluation. These thresholds are indicative, not predictive. This indicator is particularly relevant because it reflects the potential profit or loss of current holders, giving an indication of their propensity to sell.
On Santiment, the ratio between active addresses and those inactive for more than a year can signal an imminent trend change. Large crypto whales leave clues about their activity, often in places you would not expect.
Macroeconomic indicators affecting crypto
Since 2020, the relationship between cryptocurrencies and macroeconomic indicators has changed. The federal funds rate is no longer the only barometer to watch. Fluctuations in the Dollar Index (DXY) now offer arbitrage opportunities between various international stablecoins.
Bond market signals are also crucial. An inversion of the spread between 2-year and 10-year Treasury yields, for example, can affect Bitcoin differently depending on the interest-rate environment.
Regulatory watch
Regulation strongly influences market cycles. The potential approval of a spot Bitcoin ETF is just one example. Debates over classifying tokens as securities open up opportunities in certain DeFi projects.
Regulatory differences between countries, such as between Singapore and Hong Kong, create predictable capital movements. These dynamics affect stablecoins first, then spread to other market segments.
Social data analysis
Analysing social sentiment requires a detailed approach. The gaps between developer sentiment on GitHub and trader sentiment on Twitter are often revealing.
Technical discussions on specialised channels such as Discord can foreshadow market moves. It is crucial to spot these exchanges before they become public.
Modern semantic analysis tools detect subtle shifts in the language used by crypto influencers. A shift toward more defensive vocabulary can indicate an imminent market reversal.
These weak signals are visible well before an overall shift in sentiment.
Discipline over prediction
Recognizing the end of a bull run is more an art than an exact science. It requires constant vigilance and a thorough analysis of technical, fundamental and psychological signals.
Investors who adopt a methodical, diversified and emotionally disciplined approach are better prepared. They can navigate these market phases more effectively, though no approach guarantees capital preservation.
at your own pace

Investing carries risks, including the risk of capital loss. Crypto-assets are highly volatile: you could lose all or part of your investment. Past performance is not a reliable indicator of future performance. Finary is authorised as a Crypto-Asset Service Provider (CASP) under the MiCA regime by the AMF.
Frequently asked questions
How do you know when a crypto bull run is ending?
No single signal is 100% reliable, but the convergence of several indicators (an overheating RSI, whales rotating toward exchanges, media euphoria, an MVRV ratio above 3.5) significantly increases the probability of an imminent market reversal.
What is the MVRV ratio and how do you interpret it?
The MVRV (Market Value to Realized Value) ratio compares Bitcoin's current market value to its average acquisition price. A ratio above 3.5 has historically signalled potential overvaluation, while a ratio below 1 indicates possible undervaluation.
How long does a Bitcoin bull run last on average?
Since 2013, Bitcoin's major bull cycles have lasted between 11 and 18 months, depending on the cycle (2013, 2017, 2020-2021). Each cycle remains unique, however: the market's growing maturity makes historical patterns less predictable than before.
How can you protect your capital at the end of a bull cycle?
Favour gradual de-accumulation (DCA out) over an abrupt exit, adjust your withdrawals based on your total crypto exposure, and consider reallocating part of your gains to stablecoins diversified across several blockchains to limit counterparty risk.
Should you sell as soon as the Bitcoin Dominance Index drops?
No: a drop in Bitcoin dominance does not automatically signal a market top. In 2021, it fell below 40% as early as May without the market reaching its peak, which only came in November of that same year.
Sources
Chainalysis, analysis of the May 2021 crypto crash
Forbes, April 2021 liquidations (over $10 billion in 24 hours)
CoinGecko, history of Bitcoin dominance
Glassnode, guide to the MVRV ratio
CryptoQuant Academy, guide to the MVRV ratio
StatMuse, Bitcoin and Ethereum price history in 2021
Regulatory disclaimers: Marketing communication. Investing carries a risk of partial or total capital loss. Past performance is not a reliable indicator of future performance. This article is provided for information and educational purposes only; it does not constitute personalised investment advice, a buy or sell recommendation, or tax advice. Crypto-assets are highly volatile and carry a risk of total capital loss. They are not covered by any capital guarantee or by deposit-guarantee or investor-compensation schemes. Before investing, read the Key Information Document (KID) and, where relevant, consult an authorised adviser. Finary SAS, an investment firm authorised by the ACPR (no. 19283), member of AMAFI. Insurance broker registered with ORIAS (no. 21001279), member of the CNCGP (association approved by the AMF). Crypto-Asset Service Provider (CASP) authorised by the AMF under the MiCA regime, references no. A2026-026 and no. N2026-008.