Best Asia ETFs: the top 5 to invest in 2026

Updated 31 July 2026
The best Asia ETFs in 2026 are the iShares MSCI EM Asia (TER 0.20%) in a securities account, the Amundi PEA Asie Pacifique (PAEJ) in a PEA (a French tax-advantaged equity savings account), and the L&G Asia Pacific ex Japan (TER 0.10%) for the lowest fees. The choice depends on the tax wrapper and the risk profile.

- In a compte-titres ordinaire (CTO), France's standard taxable brokerage account, the iShares MSCI EM Asia UCITS ETF (TER 0.20%) offers the broadest exposure to Asian emerging markets, with €6.7 billion in assets.
- The PEA (Plan d'Épargne en Actions) requires 75% of assets to be invested in European equities, which limits eligible Asia ETFs to two synthetic products.
- The Amundi PEA Asie Pacifique (PAEJ, TER 0.60%) remains the only multi-region PEA option covering both developed and emerging Asia.
- The L&G Asia Pacific ex Japan Equity UCITS ETF has the lowest TER in this comparison, at 0.10% per year.
- Companies such as Taiwan Semiconductor, Samsung Electronics and Tencent illustrate Asia's growing weight in the global economy.
Why invest in Asia ETFs in 2026?
Companies such as Taiwan Semiconductor, Tencent and Alibaba are no longer mere market participants: they shape the global economy of the 21st century, which justifies dedicated exposure to the region through Asia ETFs.
The advantages of ETFs for investing in Asia
Investing in Asia brings unique challenges, largely because of the continent's diversity and complexity. Using ETFs is a practical way to tap Asia's potential without having to master the subtleties of local markets. Here are some of the key advantages:
- Simplified access: ETFs give exposure to hundreds of Asian companies through a single financial instrument, listed in euros.
- Liquidity: ETFs provide daily liquidity with competitive spreads, which matters in markets that can be volatile.
Economic trends in Asia and their impact on ETFs

Asia's 2026 economy is dynamic and diversified, far from the reductive image of the "world's factory". Three main trends are redefining the economic landscape:
- A growing middle class: According to the Brookings Institution, around 140 million Asians join the middle class every year. ETFs focused on discretionary consumption benefit directly from this structural trend.
- Accelerating technological innovation: Advanced technology, notably artificial intelligence and semiconductors, is seeing many Asian companies emerge.
- Energy transition: Asia is taking the lead in green technology, from batteries to smart grids.
The risks of investing in Asia through ETFs
Investing in Asia through ETFs carries risks that need to be understood in order to manage them. Here are the main ones to consider:
- Geopolitical risk: Tensions, such as those between China and Taiwan, can hit some sectors quickly.
- Sector concentration: Some ETFs can be overly concentrated in specific sectors, which increases risk in a shock.
- Corporate governance: Transparency standards vary from country to country, although ETFs with ESG filters can mitigate this risk.
- Currency risk: Asia ETFs are often exposed to several currencies, which can increase portfolio volatility.
Exposure to Asia ETFs should be sized according to your risk tolerance and investment horizon. For reference, some investors opt for measured exposure to Asia within a diversified portfolio, according to their risk tolerance and their investment horizon.
What are the best PEA-eligible Asia ETFs?
The best PEA-eligible Asia ETFs are the Amundi PEA Asie Pacifique (PAEJ, TER 0.60%), which covers developed and emerging Asia, and the Amundi PEA Asie Émergente ESG Screened (PAASI, TER 0.30%), which targets emerging Asia with an ESG filter.
The PEA imposes a major constraint on Asian exposure: 75% of assets must be invested in European equities. That rule drastically shapes the range of Asia ETFs available, creating a niche market dominated by synthetic products.
Amundi PEA Asie Pacifique: the multi-region pioneer
The PAEJ ETF offers the most complete exposure to the region, covering both developed and emerging Asia (ISIN FR0011869312). Its synthetic structure, although more expensive at 0.60% in fees, elegantly works around the PEA's restrictions.
Its physical portfolio, made up of European equities such as Novo Nordisk (9.1%) and Prosus (9.1%), serves as collateral while swaps replicate the performance of the MSCI AC Asia Pacific ex Japan index. This complex architecture explains the fee premium over conventional ETFs.
Amundi PEA Asie Emergente (MSCI Emerging Asia) Screened: the responsible alternative
Launched more recently, PAASI (ISIN FR0013412012) targets emerging Asia specifically, with an ESG filter. Its 0.30% TER, half that of PAEJ, makes it the cheapest way to gain PEA exposure to Asia.
Its ESG selection methodology, capping each holding at 5%, produces a distinct risk/return profile. The fund still keeps heavy exposure to Asian technology giants such as TSMC and Tencent, while excluding controversial companies.
The structural limits to know about
The synthetic nature of these ETFs introduces counterparty risk. It is, however, regulated under the UCITS framework.
Trading spreads are also wider than on conventional physical ETFs, which calls for limit orders.
The PEA's regulatory framework, centred on European equities, effectively excludes Asian bond ETFs. That limit deprives PEA investors of a valuable diversification tool.
For bond exposure, investors have to turn to their compte-titres ordinaire (CTO), where options such as the iShares USD Asia Investment Grade Corporate Bond ETF (ASIG, ISIN IE0007G78AC4) become available.
Performance: the price of PEA eligibility
PEA-eligible ETFs do track their benchmarks faithfully, but their synthetic structure generates additional costs. Over 5 years, the tracking-error gap with their physical equivalents averages 50 to 90 basis points a year.
This "synthetic tax" has to be weighed against the tax advantages of the PEA. On long-held positions, that advantage can, depending on the case, offset the extra costs.

What are the best Asia ETFs that are not PEA-eligible?
Outside the PEA, the best Asia ETFs are the iShares MSCI EM Asia UCITS ETF (€6.7 billion in assets, TER 0.20%), the Vanguard FTSE Developed Asia Pacific ex Japan (TER 0.15%) and the L&G Asia Pacific ex Japan Equity (TER 0.10%).
The market for Asia ETFs outside the PEA offers a wider range than PEA-eligible ETFs. That diversity can be a challenge for less experienced investors. Here are the most interesting options in 2026.
iShares MSCI EM Asia UCITS ETF: the emerging-markets heavyweight

This ETF, with €6.7 billion in assets, is a leading choice for investors who want exposure to Asian emerging markets. Its composition reflects the region's economic momentum (ISIN IE00B5L8K969):
- Taiwan Semiconductor now accounts for 17.57% of the fund, its largest holding and confirmation of Taiwan's supremacy in semiconductors.
- Samsung Electronics (9.33%) and SK Hynix (8.12%) are the second and third largest positions, a weight that illustrates South Korea's growing dominance in memory and electronics.
- Tencent (3.18%) and Alibaba (2.45%) complete the top 5, a smaller weight than in previous years that reflects the fund's diversification beyond Chinese tech.
Management fees are just 0.20%, which is very competitive for an ETF of this size.
Vanguard FTSE Developed Asia Pacific ex Japan UCITS ETF: the low-cost option

Vanguard offers this ETF (ISIN IE00B9F5YL18) with a Total Expense Ratio (TER) of just 0.15%, one of the lowest on the market.
Listed on Euronext Paris under the ticker VGEJ, it distributes dividends quarterly.
The fund is made up mainly of South Korea (around 52%, FTSE classifying that market as developed, unlike the MSCI index), Australia (around 28%) and Hong Kong (around 8%), giving exposure to the region's developed economies.
L&G Asia Pacific ex Japan Equity UCITS ETF: the quiet ESG option

This ETF (ISIN IE00BFXR5W90) stands out with a TER of just 0.10%, the lowest in its category. Its ESG approach includes:
- A systematic exclusion of companies involved in coal
- A screen for companies in breach of the United Nations Global Compact principles
- Diversification maintained despite these strict criteria
With €686 million in assets, the fund shows that its ESG approach attracts many investors.
Fee and performance comparison of non-PEA-eligible ETFs
Total cost of ownership is key to assessing an ETF. Here is a comparison table:
| ETF | TER | Average spread |
|---|---|---|
| iShares MSCI EM Asia | 0.20% | 0.04% |
| Vanguard Asia Pacific | 0.15% | 0.15% |
| L&G Asia Pacific | 0.10% | 0.18% |
Although the L&G has an attractive TER, its wider spread can erode that advantage. Liquidity matters too: the iShares ETF has high daily trading volumes, which makes large transactions easier. For investors dealing in smaller amounts, the impact of liquidity is less significant.

The Asian indices tracked by ETFs: decoding market complexity
Asian indices are not simple lists of companies. They tell the economic story of a region in full transformation, where technology dragons and traditional giants coexist.
The MSCI Emerging Markets Asia index illustrates that duality perfectly. Taiwan Semiconductor (TSMC) accounts for 17.57% of it, followed by Samsung Electronics (9.33%), SK Hynix (8.12%), Tencent (3.18%) and Alibaba (2.45%). That concentration shows emerging Asia is no longer only the world's workshop, but also a centre of innovation.
The FTSE Developed Asia Pacific ex-Japan looks radically different. Finance dominates, with Commonwealth Bank (8.7%), alongside natural resources with BHP Group (6.7%). That composition reflects the colonial legacy of Australia and Hong Kong, still anchored in a more traditional economy.
ESG indices add another dimension. The MSCI EM Asia Screened Select ex Thermal Coal, tracked by the Amundi PEA ETF, caps each position at 5%. That apparently technical rule deeply reshapes the risk/return profile. It protects against the speculative excesses that have marked the history of Asian markets.
One telling detail: "ex-Japan" indices dominate the landscape. That systematic exclusion of Japan is not incidental. It reflects a different level of market maturity and lets investors precisely calibrate their exposure to the world's fourth largest economy.
This complex architecture of Asian indices comes from decades of experience in emerging markets, where balancing growth and stability remains a constant challenge.
Performance comparison: PEA-eligible ETFs vs non-eligible ETFs
The reality of Asia ETFs is more complex than a simple comparison of gross performance. What really matters is the structure of the products and its impact on long-term returns.
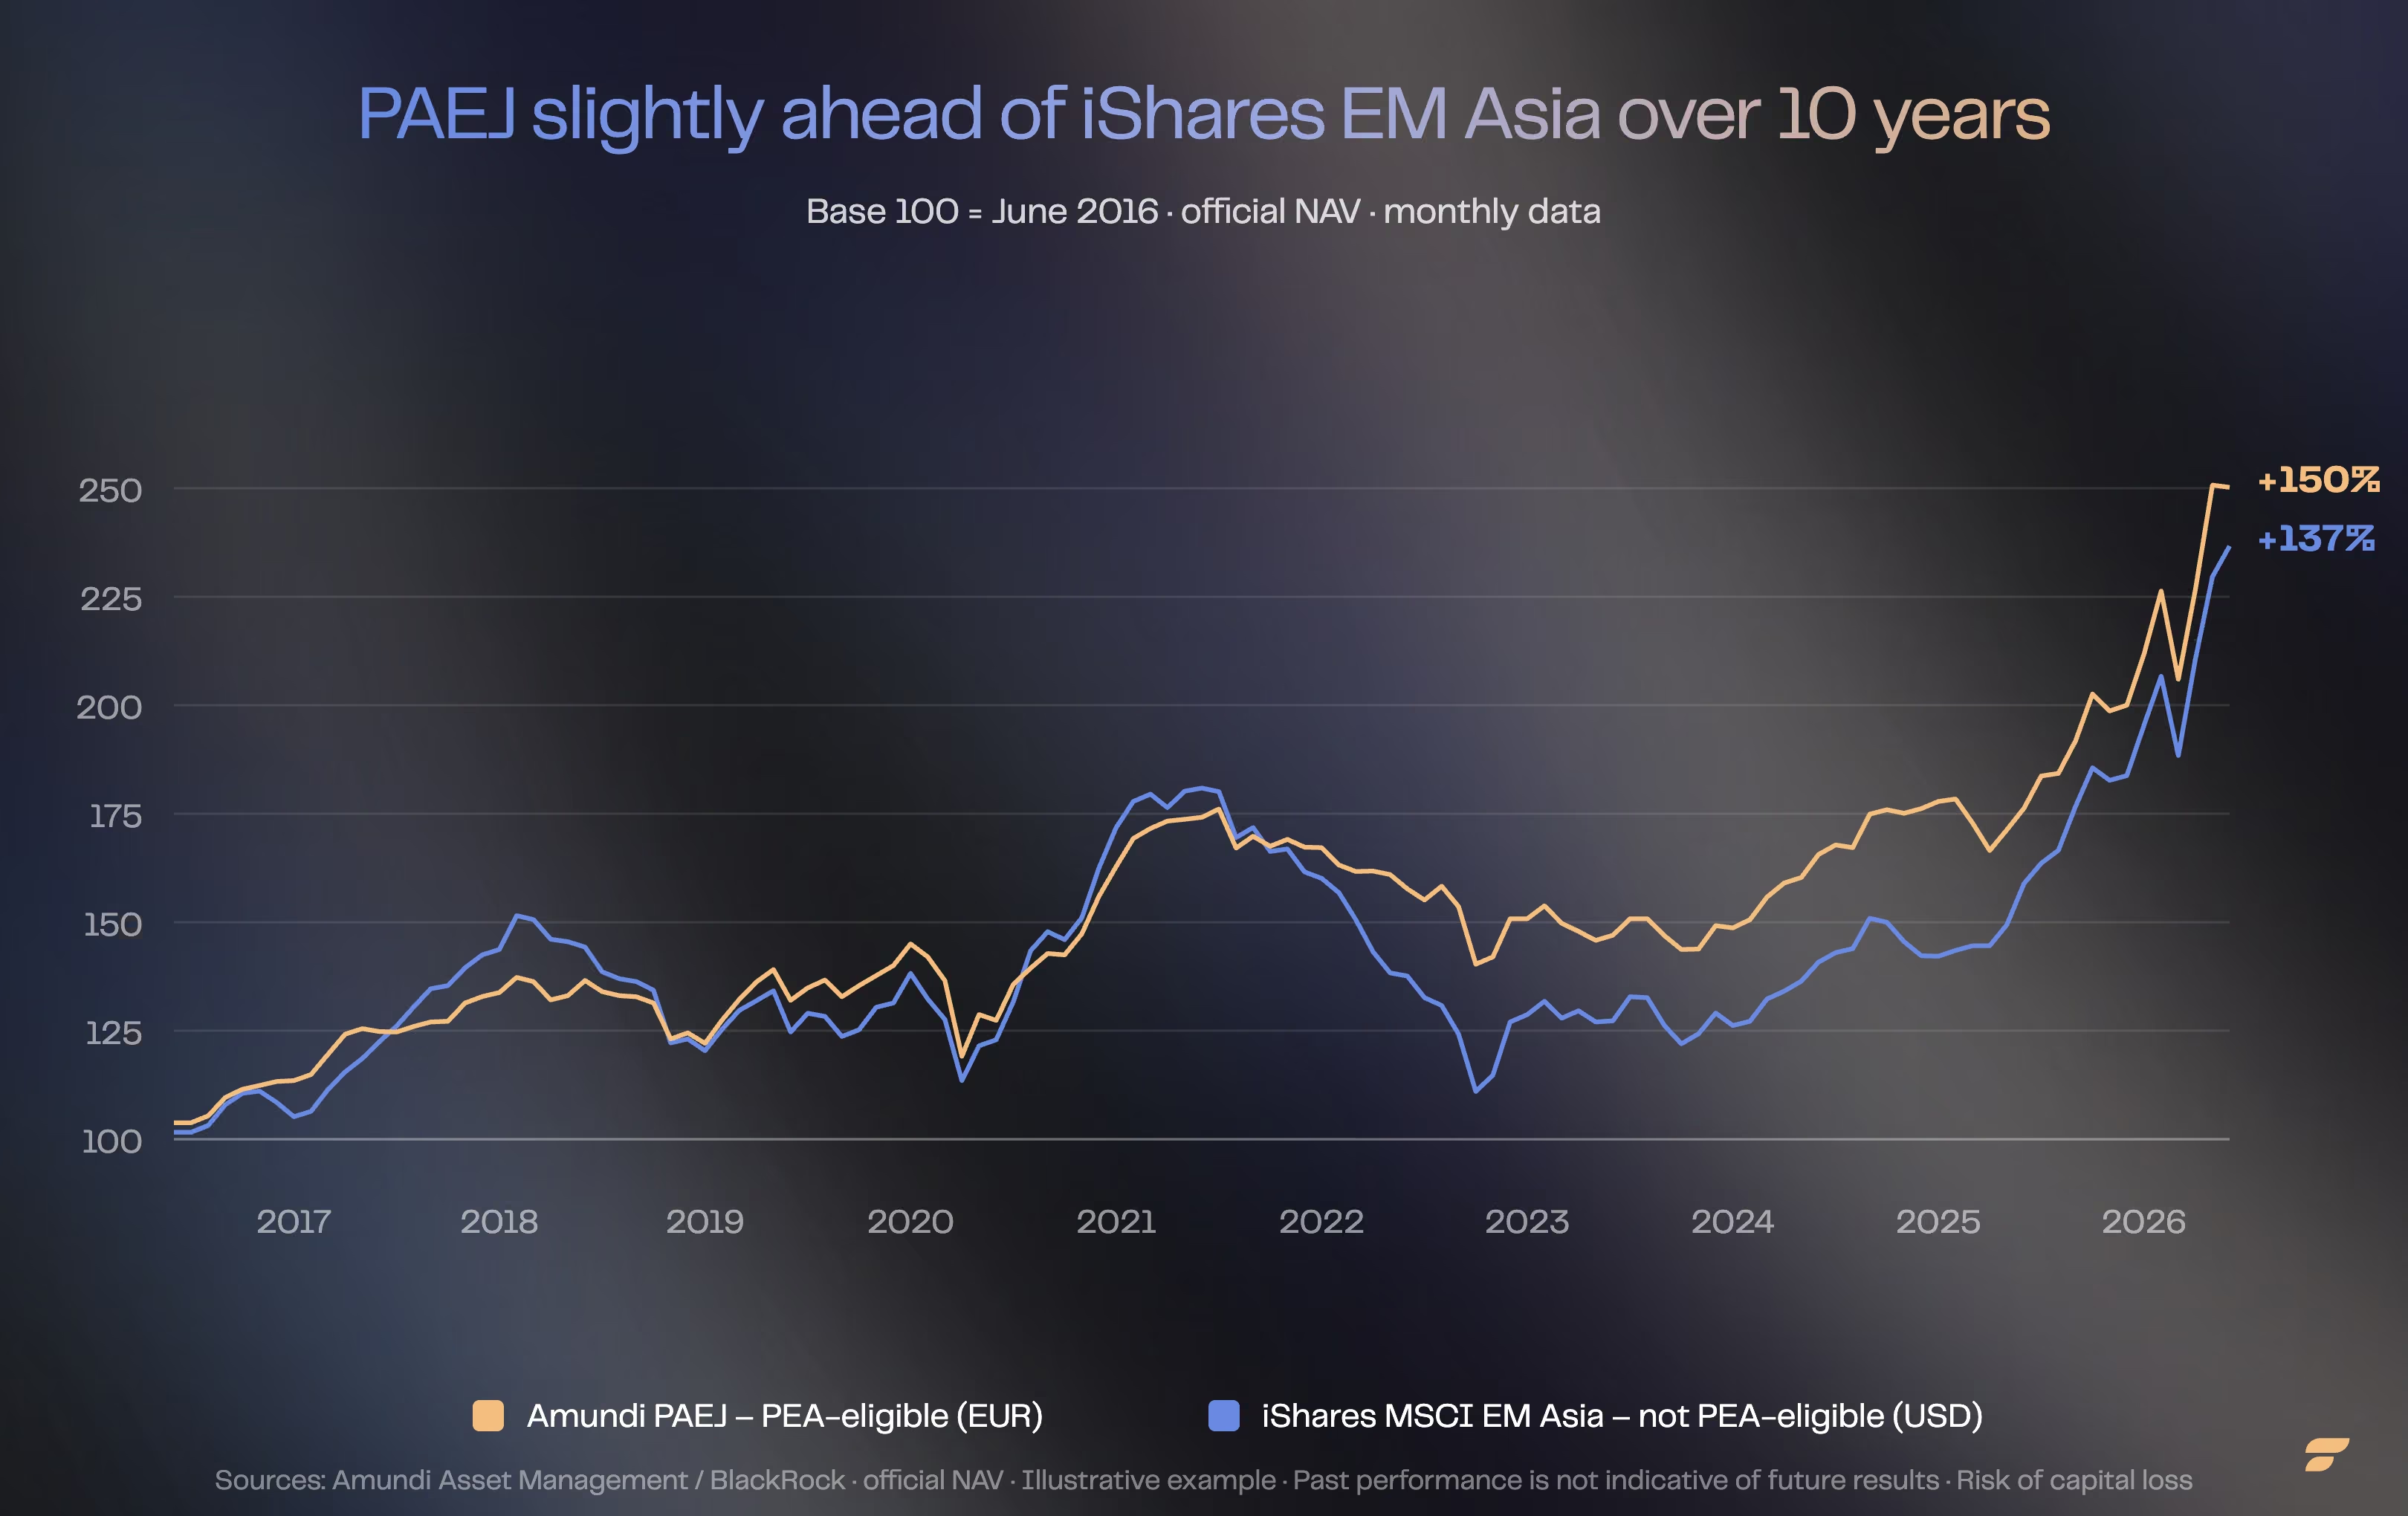
Over 10 years, PAEJ is slightly ahead (+150%) of the iShares EM Asia (+137%), though the two ETFs track different indices.
PEA-eligible synthetic ETFs have a larger tracking error, typically between 0.8% and 1.2% a year.
The gap comes from the complexity of the swaps needed to replicate Asian indices while holding a basket of European equities. In practice, an investor in the Amundi PEA Asie Pacifique may see their return reduced by around 1% versus the MSCI AC Asia Pacific ex Japan index.
Physical ETFs such as the iShares MSCI EM Asia, by contrast, have a tracking error below 0.3%. That better replication carries a tax cost for French investors taxed at the progressive income-tax scale. The flat tax (PFU) of 31.4% (social contributions 18.6% + income tax 12.8%) that has applied since 1 January 2026 to capital gains outside a PEA can quickly erode the advantage of physical replication.
For illustration only and on a non-contractual basis, using a hypothetical 8% annual return (not guaranteed; past performance is not a reliable indicator of future performance) applied to €10,000:
- 5-year horizon:
- PEA ETF (after tracking error): €13,728
- CTO ETF (after tax): €13,469
- 10-year horizon:
- PEA ETF (after tracking error): €18,861
- CTO ETF (after tax): €18,152
These figures show that, despite a higher tracking error, PEA ETFs can outperform their CTO equivalents over the long run thanks to the tax treatment.
Liquidity also plays a crucial role. The lower trading volumes of PEA ETFs mean wider bid-ask spreads, sometimes up to 0.4%. For an investor buying monthly, those repeated transaction costs can reduce performance significantly.
The choice between a PEA and a CTO therefore depends less on raw performance than on your own situation. Depending on the investment horizon and the marginal tax rate, a PEA and a CTO have different tax characteristics. That analysis is specific to each investor's situation.
Some approaches combine both wrappers: using the PEA for core exposure through synthetic ETFs, then adding physical ETFs in a CTO for more tactical strategies or specific themes unavailable in a PEA.
Accumulating and distributing options in Asia ETFs
The choice between accumulating and distributing ETFs goes well beyond the simple question "Do you want to receive dividends?". In Asia, that decision shapes your currency exposure, your tax treatment and even your investing psychology.
Distributing Asian ETFs show gross yields, often 3-4% for developed Asia-Pacific funds. Those distributions are subject to local currency swings, though. A 4% dividend can fall to 3% once converted into euros, if the Korean won or the Australian dollar loses value.
Accumulating ETFs automatically reinvest dividends in the same proportions as the index. When Samsung pays a dividend, for example, your ETF immediately buys back Samsung shares, but also TSMC, Commonwealth Bank and other Asian pillars.
Accumulating ETFs defer taxation until you sell, whereas distributions are taxed immediately. That immediate taxation can be a drawback for anyone who does not need regular income.
How can you diversify your investments in Asia?
Geographic and sector diversification
Diversifying in Asia is not just about spreading investments across several countries. It means identifying interconnected economic ecosystems. Taiwan and South Korea, for example, form a complementary technology hub: TSMC makes the chips, Samsung builds them into its products. That synergy creates natural resilience to sector shocks.

Asian value chains now extend beyond traditional borders. An ETF focused only on China would miss the Vietnamese companies in its supply chain. To capture that economic reality better, it makes sense to combine a developed Asia ETF with an emerging Asia ETF.
Tracking the performance of Asia ETFs
Classic indicators such as tracking error are no longer enough. The crucial factor is the underlying liquidity of Asian markets. An ETF can show excellent historical performance yet suffer from a lack of liquidity in stressed periods, as the turbulence in the Chinese property market showed in 2023.
Watch the ETF's average daily trading volume, but also that of the fund's largest holdings on their local markets. An ETF with 20% in illiquid Indonesian small caps carries a hidden risk, even with a low tracking error.
Asia ETFs: the choice depends on your wrapper and your profile
Whether you are constrained by PEA rules or looking for more conventional ETFs, each option has its own advantages. Those advantages suit different investor profiles and different wealth strategies. A rigorous analysis remains essential to inform your decision. That selection should rest on a thorough understanding of the indices, the replication structures and the characteristics specific to each fund.
Frequently asked questions
What is the best Asia ETF in 2026?
The best choice depends on the wrapper: in a compte-titres ordinaire (CTO), the iShares MSCI EM Asia UCITS ETF (TER 0.20%, €6.7 billion in assets) offers the broadest exposure to Asian emerging markets. In a PEA, the Amundi PEA Asie Pacifique (PAEJ) remains the only multi-region option despite higher fees of 0.60%.
Which Asia ETFs are PEA-eligible?
Only two synthetic ETFs on Asia are PEA-eligible: the Amundi PEA Asie Pacifique (PAEJ, TER 0.60%), which covers developed and emerging Asia, and the Amundi PEA Asie Émergente ESG Screened (PAASI, TER 0.30%), which targets emerging Asia specifically with an ESG filter.
Which Asia ETF has the lowest fees?
The L&G Asia Pacific ex Japan Equity UCITS ETF has the lowest TER in this comparison, at 0.10% a year, against 0.15% for the Vanguard FTSE Developed Asia Pacific ex Japan and 0.20% for the iShares MSCI EM Asia.
Why are PEA-eligible Asia ETFs synthetic?
The PEA requires 75% of assets to be invested in European equities. To work around that constraint while replicating an Asian index, issuers use a synthetic structure: a basket of European equities serves as collateral, and a swap with a bank counterparty replicates the performance of the target Asian index.
What are the risks of Asia ETFs?
Asia ETFs carry geopolitical risk (China-Taiwan tensions), sector concentration that is sometimes heavy in technology, currency risk tied to the many Asian currencies, and corporate governance standards that vary from country to country in the region.
Does a physical or a synthetic Asia ETF deliver a better net return?
It depends on the wrapper and the horizon. Physical ETFs in a compte-titres ordinaire (CTO) are subject to the 31.4% flat tax (PFU) on capital gains, whereas synthetic ETFs in a PEA benefit from lighter taxation after 5 years despite a higher tracking error, which can offset it over the long run.
Sources
justETF, iShares MSCI EM Asia UCITS ETF (Acc) profile, ISIN IE00B5L8K969
justETF, Amundi PEA Asie Pacifique UCITS ETF profile, ISIN FR0011869312
justETF, Vanguard FTSE Developed Asia Pacific ex Japan UCITS ETF profile, ISIN IE00B9F5YL18
justETF, L&G Asia Pacific ex Japan Equity UCITS ETF profile, ISIN IE00BFXR5W90
justETF, iShares USD Asia Investment Grade Corporate Bond UCITS ETF profile, ISIN IE0007G78AC4
Service-public.fr, change in the flat tax (PFU) rate from 1 January 2026
Brookings Institution, Asia's tipping point in the consumer class
Regulatory disclaimers: Marketing communication. Investing carries a risk of partial or total capital loss. Past performance is not a reliable indicator of future performance. This article is provided for information and educational purposes only; it does not constitute personalised investment advice, a buy or sell recommendation, or tax advice. Before investing, read the Key Information Document (KID) and, where relevant, consult an authorised adviser. Finary SAS, an investment firm authorised by the ACPR (no. 19283), member of AMAFI. Insurance broker registered with ORIAS (no. 21001279), member of the CNCGP (association approved by the AMF). Crypto-Asset Service Provider (CASP) authorised by the AMF under the MiCA regime, references no. A2026-026 and no. N2026-008.