European ETFs in 2026: selection, criteria and PEA taxation

Updated 31 July 2026
To invest in European equities in 2026, the most competitive ETFs track the STOXX Europe 600: the Amundi Core Stoxx Europe 600 charges 0.07% in annual fees, against 0.20% for the iShares and the Xtrackers. This guide compares these trackers, their alternatives and their eligibility for the PEA (a French tax-advantaged equity savings account).

- The Amundi Core Stoxx Europe 600 (LU0908500753) is the largest tracker in its category, with €20.4 billion in assets at the end of July 2026.
- Physically replicated STOXX Europe 600 ETFs are not eligible for the PEA, because they hold British and Swiss shares.
- To hold broad Europe in a PEA, you need a synthetic version such as the BNP Paribas Easy STOXX Europe 600 (FR0011550193).
- Over five years, these three trackers show almost identical net performance, between 62% and 63% at the end of July 2026.
- The Amundi Core EURO STOXX 50 (LU1681047236) is eligible for the PEA, but concentrates exposure on 50 large euro-area companies.
Why invest in European ETFs?
European ETFs are bought for three reasons: lower valuations than in the United States, less sector concentration and access to the PEA. A single tracker is enough to gain exposure to hundreds of companies across the continent, with annual fees often below 0.20%.
1. New momentum
For several years, US equities, especially in tech, have dominated many portfolios. In 2026 the rebalancing is confirmed: European indices keep reasonable valuations and investors continue to diversify away from the United States. The European Central Bank has ended its cycle of cuts: it raised its three key interest rates by 0.25 point on 11 June 2026, taking the deposit facility rate to 2.25% since 17 June 2026. This trend is not a one-off rebound: geographic diversification remains a priority.
Trade tensions and renewed protectionism in the United States also keep a climate of uncertainty alive. In that context, diversification remains essential to limit the risk of an over-concentrated portfolio.
2. Diversification
Rather than betting on a single company, you gain access to a broad range of businesses, from the large Swiss pharmaceutical group to the German industrial SME, by way of the French luxury leaders.
Another important advantage: European ETFs reduce risk concentration. In the United States, the seven largest capitalisations account for over 30% of the S&P 500 (34% at 29 May 2026, based on the composition of the iShares Core S&P 500 UCITS ETF). In Europe, the spread is more balanced. That more balanced spread can soften the impact of swings in a single sector or a small group of stocks.
3. Taxation
The tax treatment is also an advantage. ETFs domiciled in Ireland benefit from a tax treaty with the United States that cuts withholding tax on US dividends from 30% to 15%, an advantage Luxembourg funds do not have (Paperjam, Amundi ETF transfer from Luxembourg to Ireland). On a European equity ETF this gap stays marginal, since the dividends come from Europe. For French investors, PEA eligibility makes the European ETF particularly attractive: it combines simplicity with tax efficiency.
4. Costs
Finally, costs have fallen sharply. Some European ETFs charge annual fees below 0.10%, such as the Amundi Prime Europe, at 0.05% a year as at 31 July 2026. According to the AMF, “ETF fees are generally lower than those of ‘traditional’ funds”. Over the long run, this fee gap can affect net performance compared with actively managed funds. Passive management aims to keep fees low over the long term.
The best STOXX Europe 600 ETFs
The STOXX Europe 600 is the backbone of European equity investing. The index brings together 600 companies of every size and every sector, spread across 17 countries and 11 industries (STOXX, STOXX Europe 600 index factsheet).
For many investors it gives direct access to the diversity of the European market, while avoiding the complexity of picking individual stocks.
STOXX Europe 600 ETFs do differ in notable ways, though. Some suit investors looking for very low management fees, while others prioritise liquidity or tax simplicity.
ETFs differ not only in their TER (Total Expense Ratio, total annual fees), but also in their replication method, fund size and tax domicile. These often overlooked criteria weigh heavily on long-term performance. Here is our selection of the best STOXX Europe 600 ETFs.
Amundi Core Stoxx Europe 600
The Amundi Core Stoxx Europe 600 UCITS ETF Acc (the UCITS label designates a harmonised European fund that can be sold to retail investors) has a TER of 0.07%. This accumulating fund, domiciled in Luxembourg, manages close to €20.4 billion in assets as at 31 July 2026. Its full physical replication reassures investors who want to know exactly what their portfolio holds. This fund combines low fees, high liquidity and good transparency, which explains its popularity with European investors.
iShares STOXX Europe 600

The iShares STOXX Europe 600 UCITS ETF, for its part, distributes dividends and charges a TER of 0.20%. It appeals to investors who want to receive their dividends regularly.
Its German domicile can have specific tax consequences, notably for French residents. Its size (over €9 billion), however, ensures tight spreads and efficient execution.
Xtrackers Stoxx Europe 600

The Xtrackers STOXX Europe 600 UCITS ETF 1C accumulates dividends and also uses full physical replication.
Its TER of 0.20% puts it mid-table, but it stands out for being listed on several European exchanges.
That feature is of particular interest to active investors, or to those who want to switch between currencies.
The table below summarises the main characteristics for easier comparison:
| ETF | ISIN | TER (%) | Replication | Dividends | AUM (€bn) | Domicile |
|---|---|---|---|---|---|---|
| Amundi Core Stoxx Europe 600 Acc | LU0908500753 | 0.07 | Full physical | Accumulating | 20.4 | Luxembourg |
| iShares STOXX Europe 600 (DE) | DE0002635307 | 0.20 | Full physical | Distributing | 9.6 | Germany |
| Xtrackers Stoxx Europe 600 1C | LU0328475792 | 0.20 | Full physical | Accumulating | 4.2 | Luxembourg |
Fees (TER) and assets (AUM) as at 31 July 2026. Sources: product factsheets Amundi Core Stoxx Europe 600, iShares STOXX Europe 600 and Xtrackers STOXX Europe 600 on justETF. Assets change over time.
Over five years, the net performance of these three ETFs stays very close, between 62% and 63% at the end of July 2026 (dividends reinvested, in euros; source justETF). Past performance is not a reliable indicator of future performance. The differences therefore lie elsewhere: taxation, distribution policy, liquidity, and availability from one broker to another.
The replication method deserves particular attention. All three ETFs use full physical replication, which offers strong transparency on portfolio composition.
Fund domicile also plays an important role. An ETF based in Ireland benefits from a more favourable tax treaty on US dividends (15% withholding instead of 30%), which a Luxembourg fund does not. Depending on your personal tax situation, these factors can affect the net performance of your investment.
Want to diversify your portfolio beyond Europe? Read our selection of the best Asia ETFs to invest in Asian markets.

Alternatives to STOXX Europe 600 ETFs
The STOXX Europe 600 dominates European portfolios, but there are other ways to invest in the continent.
iShares Core MSCI Europe UCITS
The iShares Core MSCI Europe UCITS ETF offers broad, methodical exposure to Europe. Its index, the MSCI Europe, covers roughly 85% of the free-float market capitalisation of 15 developed European countries, including the United Kingdom and Switzerland, or 403 companies as at 30 June 2026.
These two markets, often overlooked by French investors, play an important role in the sector and geographic balance of a portfolio.
This ETF balances large caps (ASML, HSBC, Roche, AstraZeneca, Nestlé, Shell) with marked sector diversity. Financials (22.5%) and industrials (18.0%) lead, ahead of technology (9.5%) and healthcare (8.5%), as at 31 July 2026 (justETF).
| Holding | Sector | Weight |
|---|---|---|
| ASML Holding | Technology | 4.47% |
| HSBC Holdings | Financials | 2.30% |
| Roche Holding | Healthcare | 2.11% |
| AstraZeneca | Healthcare | 2.00% |
| Novartis | Healthcare | 1.97% |
| Nestlé | Consumer staples | 1.87% |
| Shell | Energy | 1.87% |
| Siemens | Industrials | 1.68% |
| SAP | Technology | 1.67% |
| Banco Santander | Financials | 1.35% |
Top ten holdings of the iShares Core MSCI Europe UCITS ETF (IE00B4K48X80) as at 31 July 2026. Source: justETF. No single line exceeds 4.5% of assets, which illustrates the lower concentration of the European market.
With a TER of 0.12% (accumulating share class, ISIN IE00B4K48X80), it stays highly competitive, which improves net performance over the long run.
Optimised sampling replication is a key point. The ETF selects a representative subset of the index, which cuts transaction costs while staying closely aligned with the index.
That choice limits tracking error, but means not holding every stock in the index. This trade-off suits those looking for simplicity and liquidity.
Amundi EURO STOXX 50 UCITS ETF
The Amundi Core EURO STOXX 50 UCITS ETF (ISIN LU1681047236) targets the 50 largest capitalisations in the euro area. It excludes the United Kingdom and Switzerland, focusing solely on the euro area.
This concentration means Germany (30.1%) and France (27.2%) dominate heavily, with the top ten lines representing 42.5% of the index as at 31 July 2026 (justETF).
| Country | Weight in the index |
|---|---|
| Germany | 30.1% |
| France | 27.2% |
| Netherlands | 19.1% |
| Spain | 10.5% |
| Other euro-area countries | 13.1% |
Geographic breakdown of the Amundi Core EURO STOXX 50 UCITS ETF (LU1681047236) as at 31 July 2026. Source: justETF. Four countries account for nearly 87% of the index, which explains its higher volatility than a broad European index.
This positioning heightens volatility and exposure to the European giants (ASML, LVMH, SAP and others). When those companies outperform, the ETF can beat broader indices. But the absence of Swiss or British defensive sectors can increase sensitivity in market falls.
The ETF has a TER of 0.09%, highly competitive for such targeted exposure.
Full physical replication reassures those who want to avoid counterparty risk. This tracker is directly eligible for the PEA, with no need for a synthetic version (justETF, as at 31 July 2026).
This tracker is for those willing to concentrate their portfolio on the industrial and financial core of the euro area, rather than for those seeking maximum diversification.
Vanguard FTSE Developed Europe UCITS
Vanguard offers rigorous passive management with the FTSE Developed Europe UCITS ETF.
This ETF tracks an index close to the STOXX 600 and the MSCI Europe, but with a methodology of its own from FTSE.
The portfolio gives significant room to the United Kingdom, Switzerland, Germany and France, with a slightly different sector weighting, notably a higher weight for energy and British financials.
The TER of 0.10% (accumulating share class, ISIN IE00BK5BQX27, €2.9 billion in assets as at 31 July 2026) stays true to Vanguard's low-fee policy. Full physical replication guarantees that every stock in the index is held, with no recourse to complex instruments.
One aspect often ignored: the Irish domicile. Thanks to the tax treaty between Ireland and the United States, withholding tax on US dividends falls to 15% instead of 30% (Paperjam, domicile of UCITS ETFs). Vanguard also offers a distributing version, suited to those who want regular income.
Moving away from the STOXX Europe 600 means choosing between broad diversification and concentration on the euro-area leaders. Each ETF reflects a different investment philosophy: maximum diversification, deliberate concentration or cost optimisation.

How to choose a European ETF
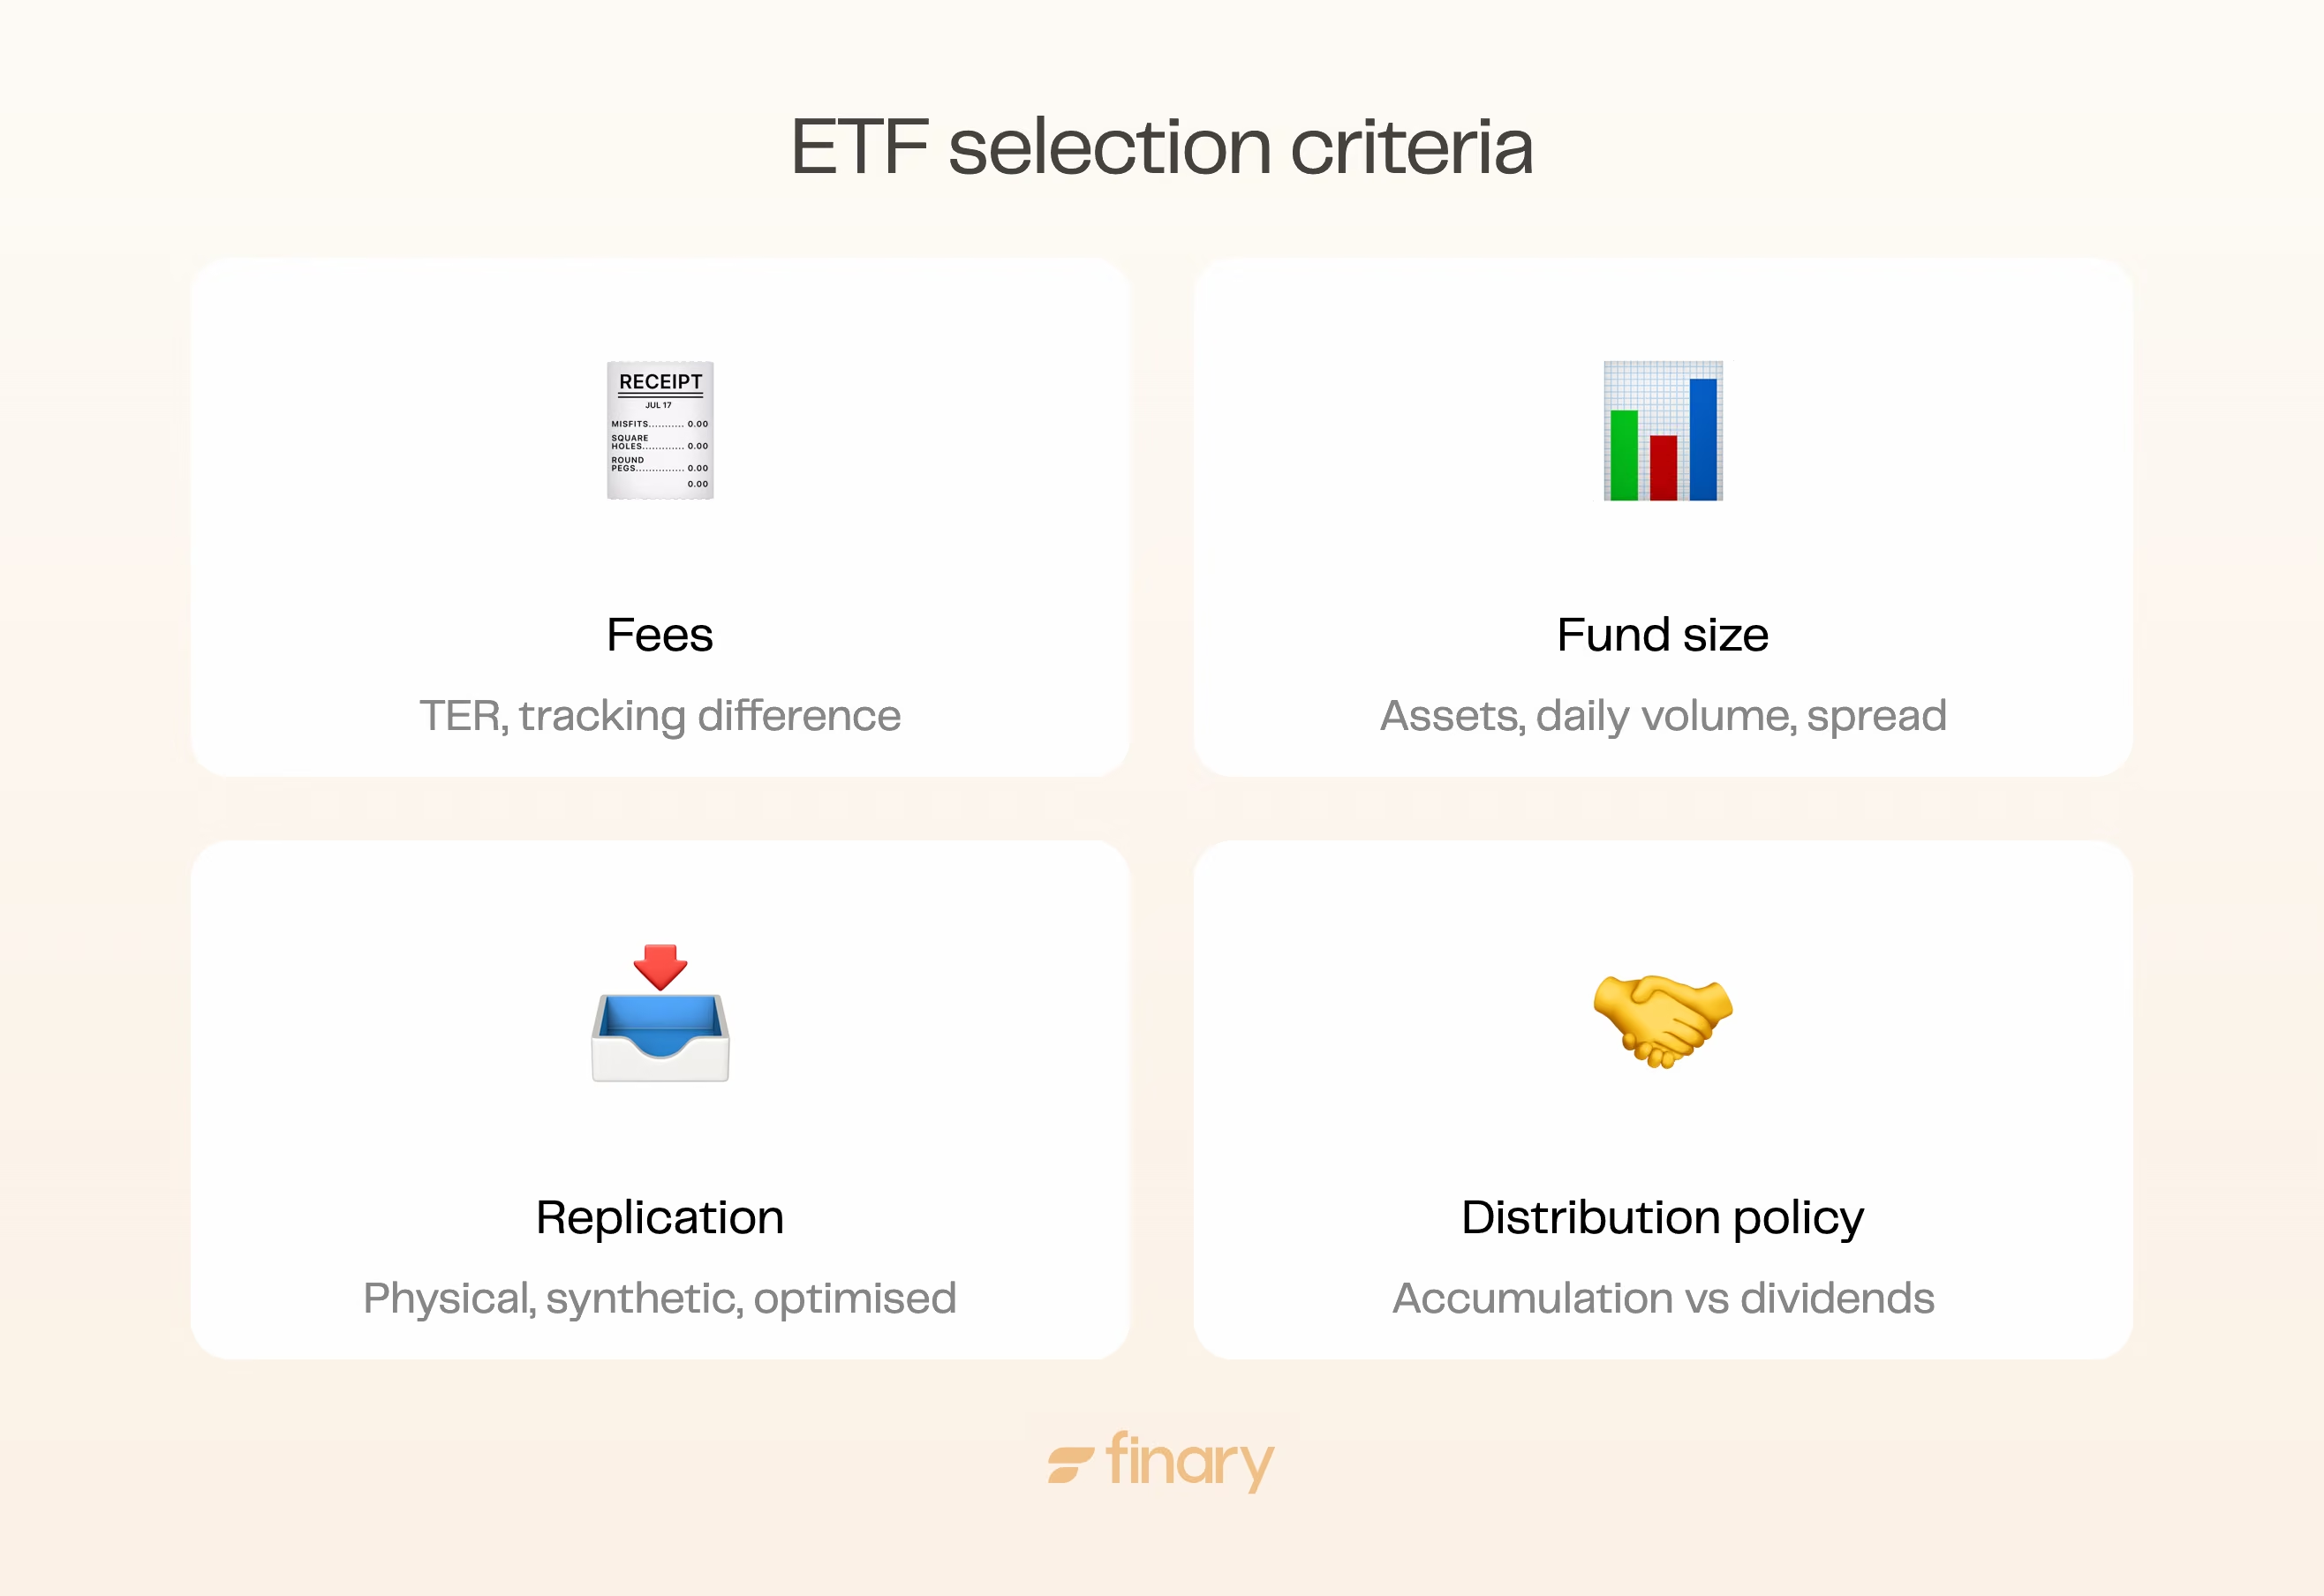
To choose a European ETF, compare four criteria in this order: fund size, annual fees (TER), replication method and dividend distribution policy. Focusing only on fees may seem logical, but an ETF is both access to a market and a financial product with mechanisms of its own.
- Fund size (AUM): A large ETF generally offers better liquidity, tighter price spreads and a very low risk of closure. A €10 billion fund, for example, is more reassuring than a €50 million one, even if the latter looks attractive on paper.
- Fees (TER): Annual fees, expressed as a percentage, look low in the short term. Over 10 or 20 years, though, the gap between 0.07% and 0.20% can represent several thousand euros of cumulative performance. In practice, lower fees can affect net performance over the long term.
- Replication: An ETF can replicate its index physically or synthetically. Physical replication reassures through its transparency, while synthetic replication can offer more precise index tracking or tax advantages.
- Distribution policy: An ETF can accumulate or distribute dividends. Investors in the accumulation phase often prefer accumulation to benefit from compound interest. Those who want regular income, or who invest via a PEA, may favour distribution.
Building a balanced portfolio with European ETFs
Building an ETF portfolio is like picking a football team. Choosing the best individual players is not enough. You also have to look for balance, complementarity and the ability to get through difficult periods.
Many investors pick one “star” ETF and stop there. Yet real efficiency appears when several funds are combined, each playing a precise role in the overall strategy.
The examples below are purely illustrative and do not constitute a personalised recommendation:
Diversified international growth portfolio
This balanced portfolio combines Europe with global exposure:
- 50% iShares Core MSCI World: global exposure to developed markets, low fees (0.20%)
- 30% Amundi Core Stoxx Europe 600: reinforcing European exposure for stability
- 20% Amundi MSCI Emerging Markets: diversification into emerging markets with strong potential
This illustrative example aims for diversification across geographic zones, with a strategic overweight in Europe while benefiting from the momentum of international markets.
Sustainable thematic portfolio
For investors concerned with environmental and social issues:
- 40% UBS Core MSCI Europe (LU0446734104): a solid base on the European market
- 30% Amundi MSCI World Climate Paris Aligned (IE000CL68Z69): global companies aligned with the climate transition
- 20% BNP Paribas Easy ECPI Global ESG Blue Economy: exposure to companies contributing to the ocean economy
- 10% iShares Global Clean Energy Transition (IE00B1XNHC34): focus on renewable energy
This portfolio combines environmental conviction with geographic diversification, with Europe as the central pillar, complemented by global thematic exposures.
Balanced factor portfolio
For an approach based on performance factors:
- 40% Amundi Prime Europe (LU1931974262): broad exposure to the European market at 0.05% in annual fees
- 25% iShares Edge MSCI World Value Factor: undervalued global companies
- 20% iShares Edge MSCI World Momentum Factor: fast-growing global companies
- 15% SPDR S&P U.S. Dividend Aristocrats: exposure to US stocks with growing dividends
This approach draws on different performance factors while keeping a solid European base.
Europe can bring geographic and sector diversification, while other markets bring growth and complementary opportunities. What matters most is matching the composition to your own objectives, your investment horizon and your risk tolerance. Apps like Finary let you track these different lines in one place, whatever broker you use.
Which European ETFs are eligible for the PEA?
To be eligible for the PEA, an ETF must invest more than 75% of its assets in shares of companies in the European Union or the European Economic Area, which limits the choice to certain indices and broadly excludes companies outside the EU/EEA. Some issuers use synthetic replication (swaps) to give access to major indices while respecting these constraints.
Careful: STOXX Europe 600, MSCI Europe and FTSE Developed Europe ETFs using physical replication are not eligible for the PEA, because they contain British and Swiss shares. To hold broad Europe in a PEA, you need a synthetic version, such as the BNP Paribas Easy STOXX Europe 600 (FR0011550193, swap replication, TER 0.19%, PEA eligible), or to stick to a euro-area ETF such as the EURO STOXX 50.
Still weighing up a PEA against a securities account for your European ETFs? The essential differences between these two wrappers are set out in our detailed guide: PEA or securities account.
Dividend distribution policy also deserves thought. Accumulating ETFs are often favoured in a PEA to maximise the compounding effect. Some investors, though, prefer to receive regular income, even if that means immediate tax on the dividends paid out.
Frequently asked questions
Which is the best STOXX Europe 600 ETF in 2026?
There is no universal “best” ETF. The Amundi Core Stoxx Europe 600 appeals through its very low fees (TER 0.07%) and its dividend accumulation, while the iShares STOXX Europe 600 will suit investors looking for a regular income stream.
Is a European ETF eligible for the PEA?
Yes, provided it invests more than 75% of its assets in shares of companies in the European Union or the EEA. Some issuers use synthetic replication to make broader indices eligible while respecting that rule.
Should you choose an accumulating or a distributing ETF in a PEA?
In the accumulation phase, an accumulating ETF automatically reinvests dividends and maximises the effect of compound interest. A distributing ETF pays regular income, useful for those who want cash, but less optimal for growing capital.
STOXX Europe 600 or EURO STOXX 50: what is the difference?
The STOXX Europe 600 covers 600 companies across the whole of Europe, the United Kingdom and Switzerland included. The EURO STOXX 50 is limited to the 50 largest capitalisations in the euro area alone: more concentrated, more exposed to France and Germany, and therefore more volatile.
What fees should you expect for a European ETF?
European ETFs are among the cheapest funds on the market. Annual management fees (TER) often range from 0.07% to 0.20%. Over 10 to 20 years, that seemingly tiny gap can represent several thousand euros of net performance.
Sources
AMF, Trackers (ETFs): understanding listed index funds
Service-public.gouv.fr, Plan d'épargne en actions (PEA): eligible securities and caps
Service-public.gouv.fr, social security levies (CSG, CRDS) on investment income
European Central Bank, key interest rates and history of decisions
STOXX, STOXX Europe 600 index factsheet
MSCI, MSCI Europe index factsheet (EUR)
justETF, Amundi Core Stoxx Europe 600 UCITS ETF Acc factsheet (LU0908500753)
justETF, iShares STOXX Europe 600 UCITS ETF DE factsheet (DE0002635307)
justETF, Xtrackers STOXX Europe 600 UCITS ETF 1C factsheet (LU0328475792)
justETF, iShares Core MSCI Europe UCITS ETF EUR Acc factsheet (IE00B4K48X80)
justETF, Amundi Core EURO STOXX 50 UCITS ETF EUR Acc factsheet (LU1681047236)
justETF, Vanguard FTSE Developed Europe UCITS ETF EUR Acc factsheet (IE00BK5BQX27)
justETF, BNP Paribas Easy STOXX Europe 600 UCITS ETF factsheet (FR0011550193)
Regulatory disclaimers: Marketing communication. Investing carries a risk of partial or total capital loss. Past performance is not a reliable indicator of future performance. This article is provided for information and educational purposes only; it does not constitute personalised investment advice, a buy or sell recommendation, or tax advice. Before investing, read the Key Information Document (KID) and, where relevant, consult an authorised adviser. Finary SAS, an investment firm authorised by the ACPR under no. 19283, member of AMAFI. Insurance broker registered with ORIAS under no. 21001279, member of the CNCGP (association approved by the AMF). Crypto-Asset Service Provider (CASP) authorised by the AMF under the MiCA regime, references no. A2026-026 and no. N2026-008.