Private Equity Performance: Indicators, Returns, and Complete 2026 Guide


Updated on 10 August 2026
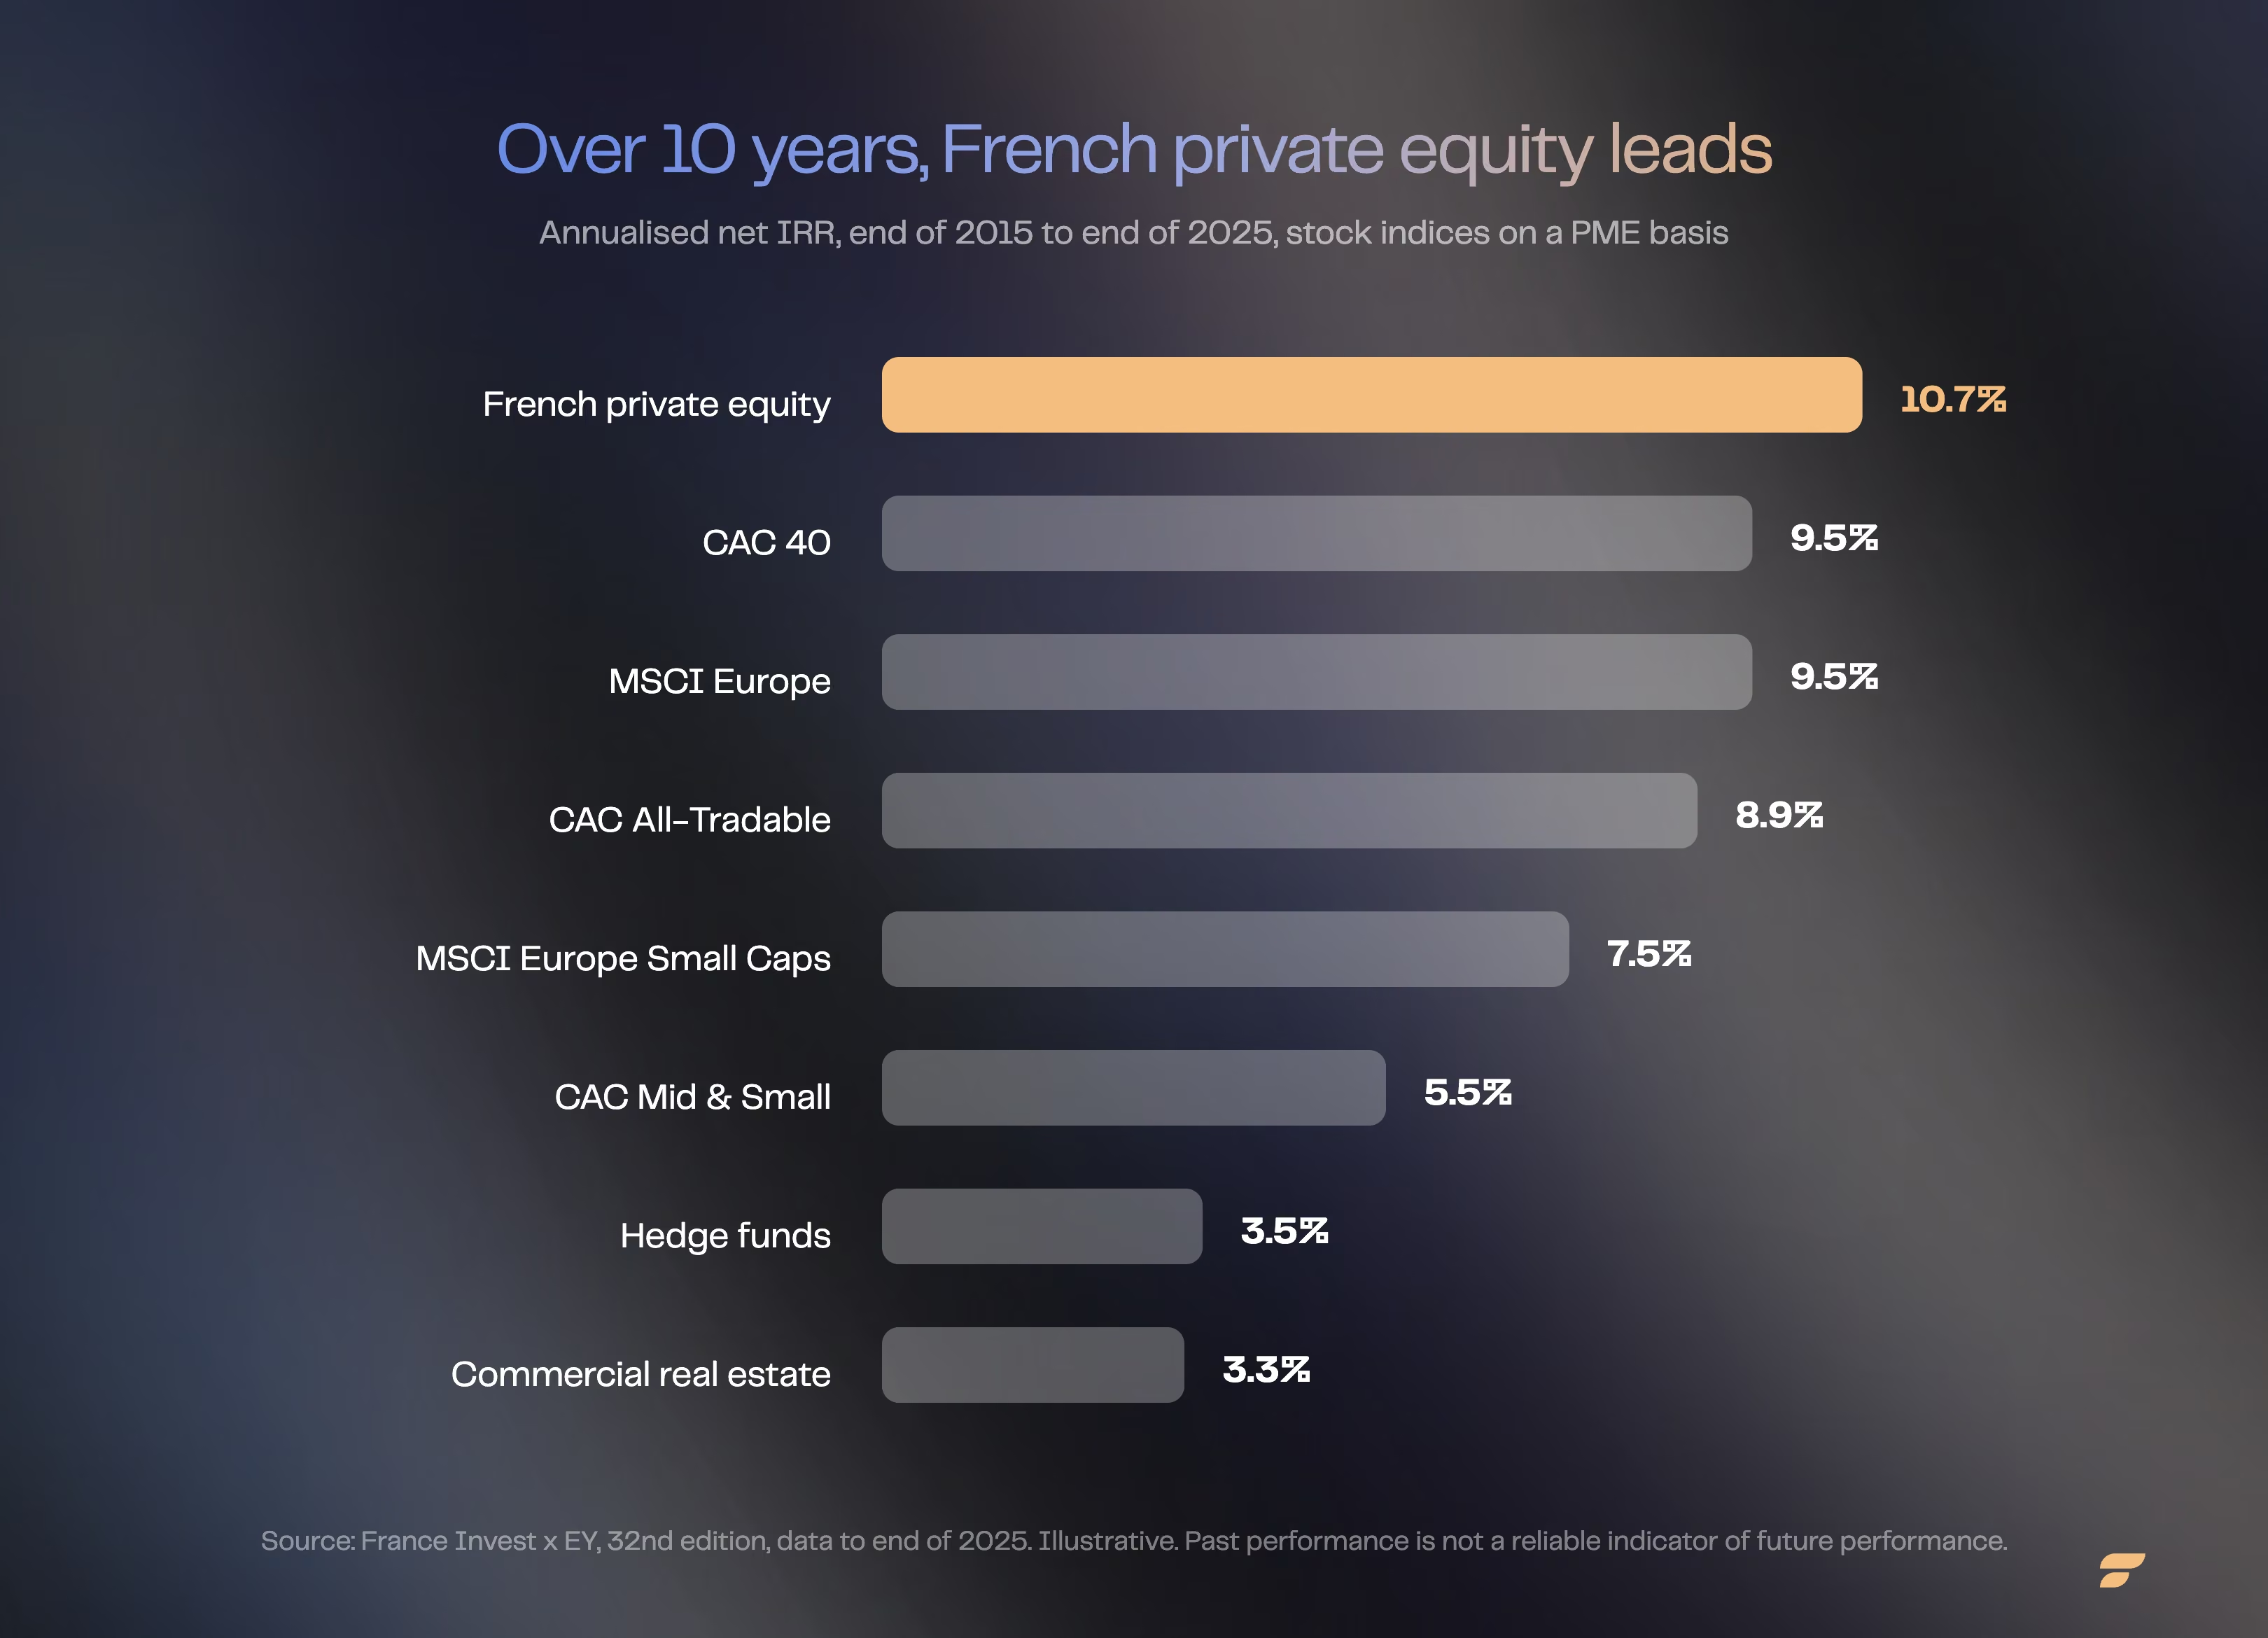
In France, private equity has delivered an average net IRR of 10.7% over 10 years, versus 9.5% for the CAC 40 over the same period, though with wide dispersion between managers and a risk of capital loss. This guide explains how to measure performance (IRR, TVPI, DPI, MOIC) and what it means for an investor.

- Past private equity performance is never a guide to future performance: the gap between the best and worst-performing funds can be considerable.
- Beyond IRR, the TVPI, DPI and RVPI multiples track a fund's maturity and the share already distributed to investors.
- The global private equity industry manages around $5.8 trillion in assets, including about $3.7 trillion of capital not yet deployed.
- Funds typically remain locked up for 7 to 10 years, an illiquidity that carries a real risk of capital loss.
- Finary One gives investors with at least €1,000,000 in investable assets access to a selection of private equity funds.
What is private equity performance, and how is it built?
Private equity performance builds up over several years through the operational transformation of portfolio companies, not through the simple movement of a share price.
What is private equity, and why is its performance different?
As an asset class, private equity functions like a discreet laboratory of finance, far removed from the turmoil of listed markets. It supports the growth of many companies that are often unknown to the wider public.
In this space, there is no real-time pricing, and no volatility driven by social media or algorithms. Performance builds over the long term, through strategic choices, operational transformation and sometimes long-term positioning.
What sets private equity apart is the multi-year commitment, typically 7 to 10 years. Investors cannot withdraw at will. This illiquidity, often seen as a constraint, is what unlocks value-creation levers that public markets cannot offer.
Fund managers get actively involved: they restructure, hire and redirect companies. Performance comes from deep transformation, not from a simple market effect.
As a result, private equity returns do not always track listed markets. They can outperform, but they can also disappoint if the manager lacks judgment or execution. Performance then reflects skill, a network, and the ability to anticipate and act with precision.
The different private equity segments and what they mean for expected returns
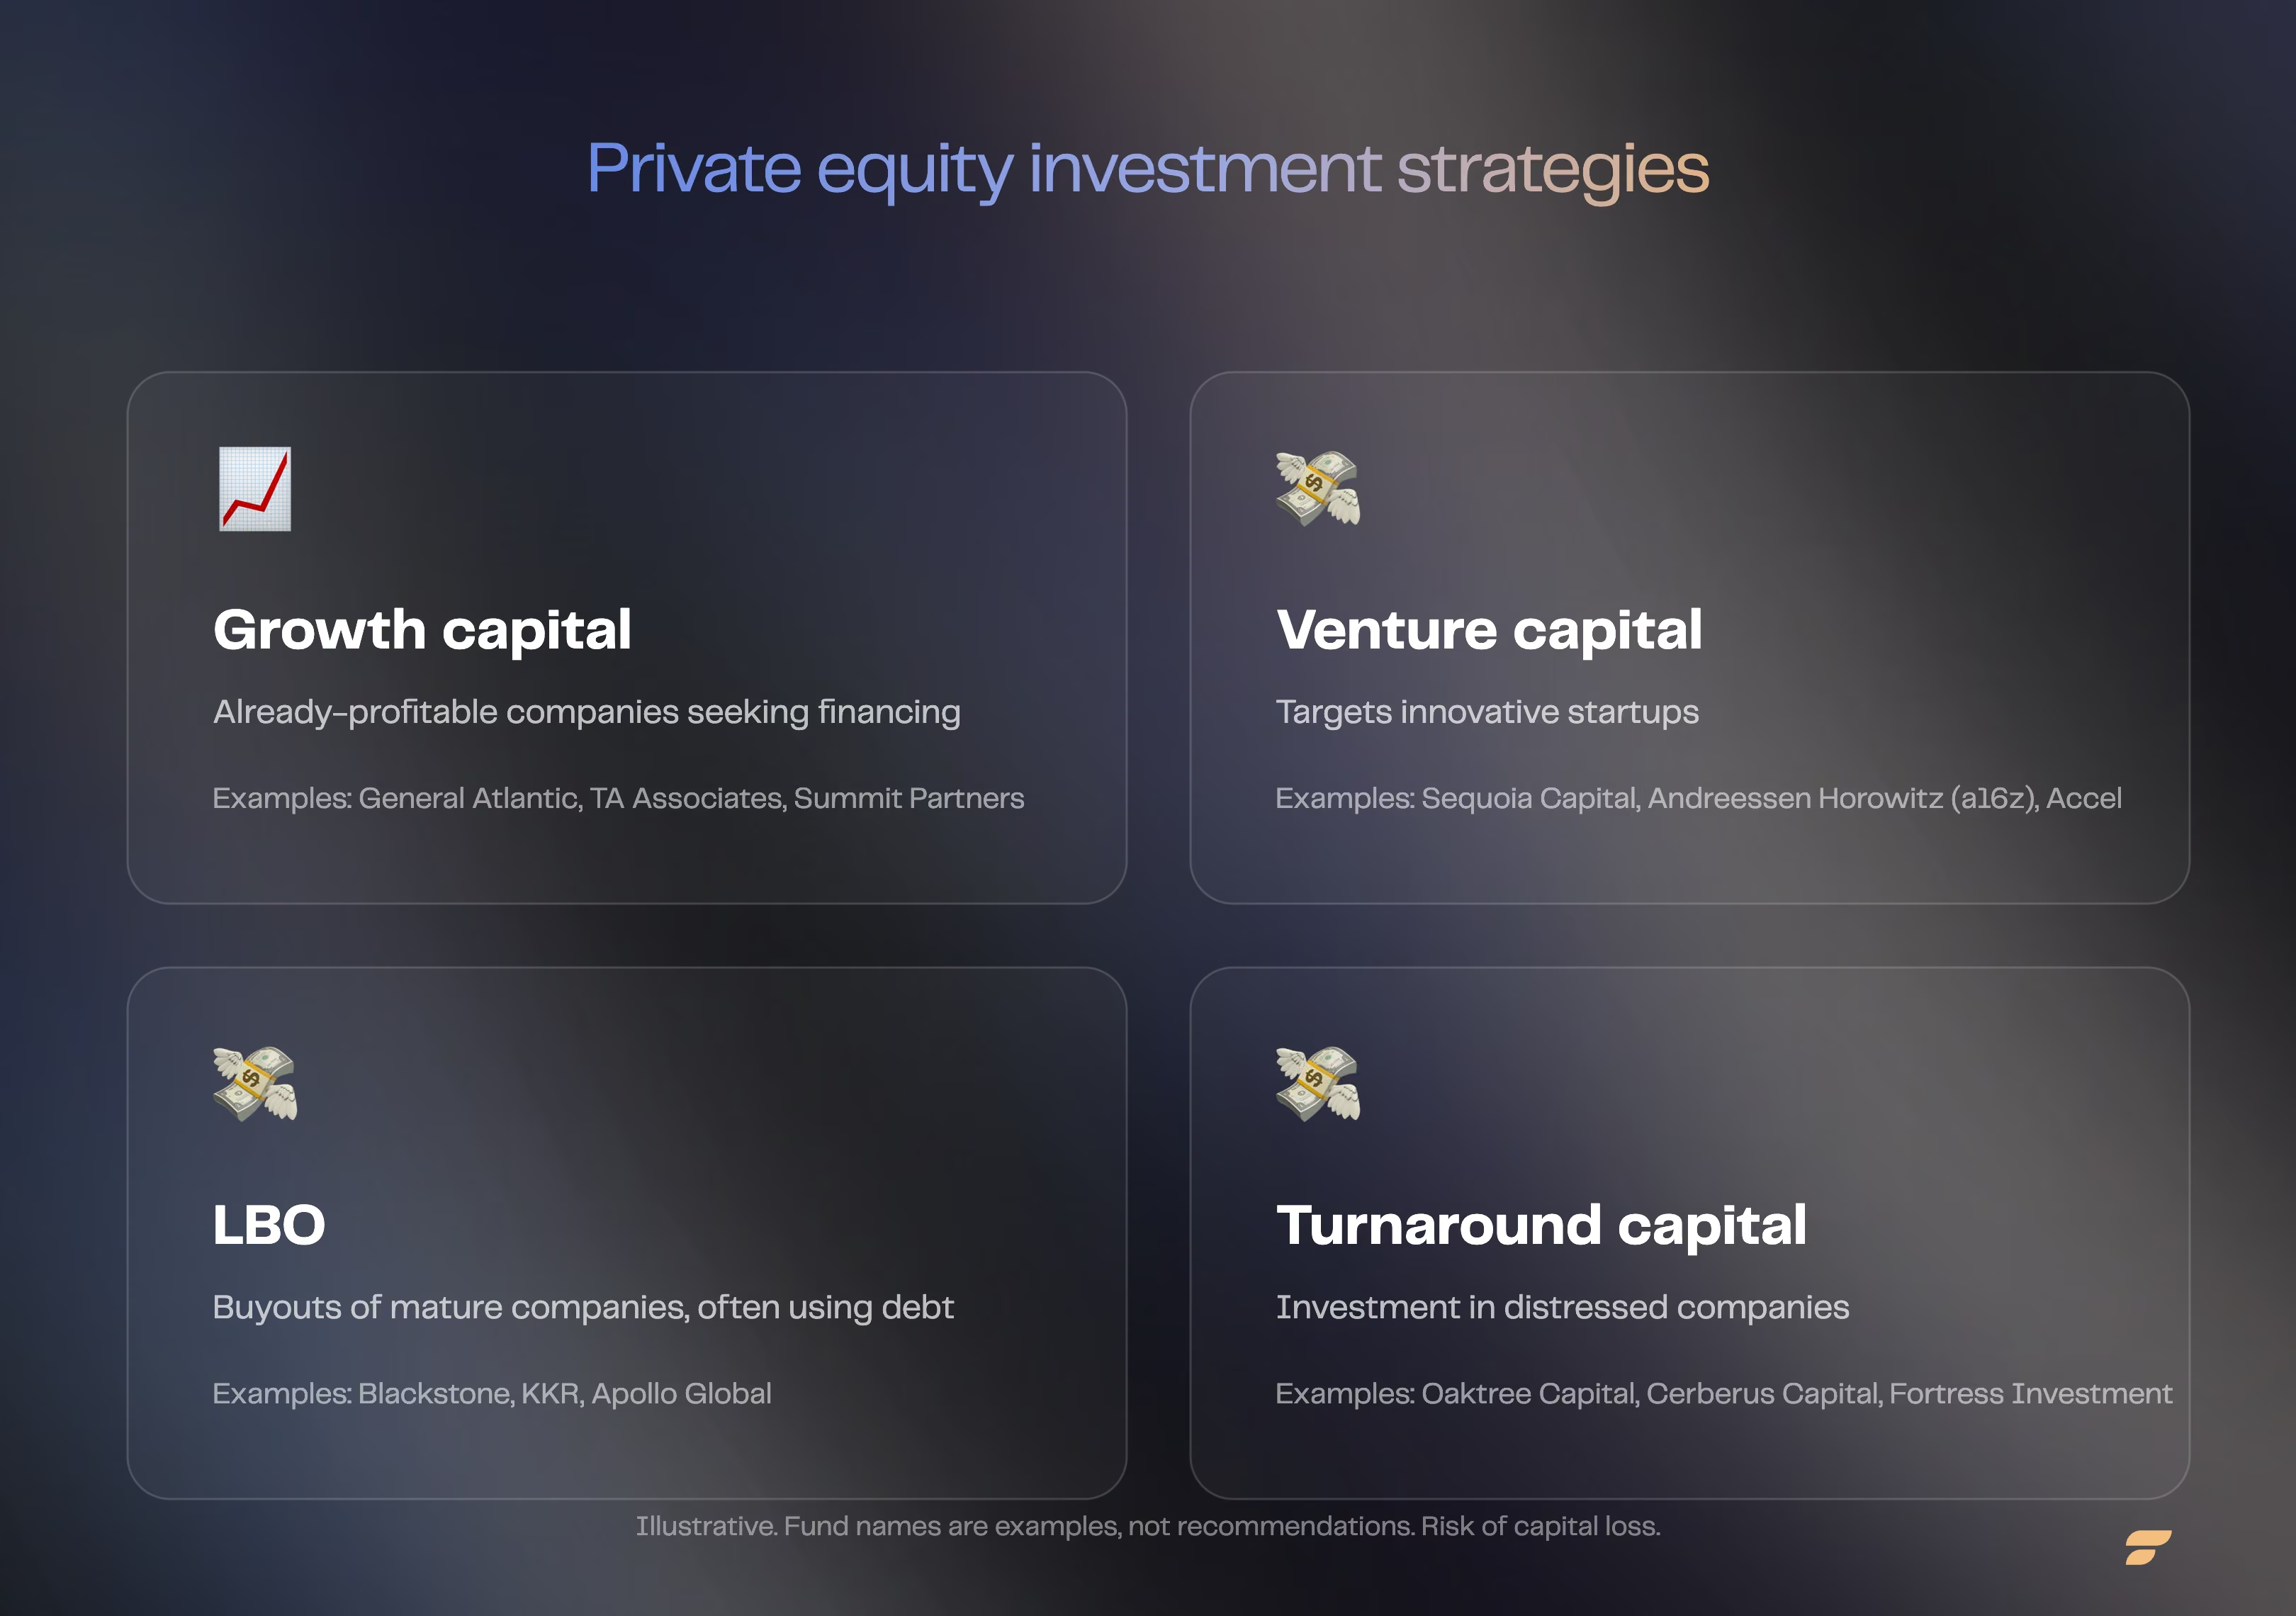
Broadly speaking, private equity spans several segments, each with its own risk and return dynamics. Each segment carries its own specific challenges and opportunities:
- Venture capital: This segment invests in innovation, particularly in tech startups, biotech or clean energy. The return potential is high, but so is the risk of loss.
- Growth capital: This targets already-established companies looking to accelerate their growth. The risk is more moderate, and so is the return.
- Buyouts (LBO): Funds acquire mature companies, often using leverage, to transform and resell them. Potential returns can be high, but the debt significantly increases the risk.
- Turnaround capital: This segment targets companies in difficulty. The risk is at its highest, and while a successful recovery can generate high returns, the risk of a total loss is significant.
Each segment shapes a portfolio's overall performance. How capital is allocated across segments drives the portfolio's overall risk-return profile.
The life cycle of a private equity fund, and why dry powder matters
A private equity fund follows several key stages. It all starts with fundraising: investors commit capital, but the funds are not invested immediately. This initial phase is crucial.
Managers then look for opportunities. In the meantime, the capital sits available as "dry powder", funds ready to be invested when the moment is right.
The investment phase spans several years. Companies join the portfolio, and the transformation begins. A maturation period follows, during which the manager supports, restructures and prepares the exit. Patience is essential, because value creation takes time.
Finally, the fund enters its liquidation phase. Assets are sold, and gains are distributed. Performance often only becomes tangible many years after the initial investment.
How do you measure the performance of a private equity fund?
The performance of a private equity fund is measured with four complementary indicators: IRR, TVPI, DPI and RVPI, each shedding light on a different stage of the investment cycle.
The Internal Rate of Return (IRR)
IRR is the benchmark for analysing irregular cash flows, unplanned capital calls and sometimes-delayed distributions. Unlike the annualised performance of a listed fund, IRR factors in the exact timing of each flow.
For example, an investor puts in €100,000 in 2025. They receive €20,000 in 2028, €50,000 in 2030, and then €60,000 in 2033. An IRR of 12% means a placement earning 12% a year over the same period would have produced an equivalent result. IRR highlights the impact of timing.
Performance multiples: TVPI, DPI, RVPI
- TVPI (Total Value to Paid-In): total value generated divided by capital invested.
- DPI (Distribution to Paid-In): cash already returned to the investor.
- RVPI (Residual Value to Paid-In): residual value not yet realised.
DPI + RVPI = TVPI. These indicators reveal a fund's maturity.

The Multiple on Invested Capital (MOIC)
MOIC answers a simple question: by how much has my investment been multiplied? A MOIC of 2x means the capital has doubled. It does not account for time.
How to calculate a fund's performance: a simplified example
Consider a fund that calls €1 million in 2025. It distributes €300,000 in 2029, then €1.2 million in 2033. At closing, €100,000 of residual value remains.
- DPI: (300,000 + 1,200,000) / 1,000,000 = 1.5x
- RVPI: 100,000 / 1,000,000 = 0.1x
- TVPI: 1.5x + 0.1x = 1.6x
- MOIC: (1,500,000 + 100,000) / 1,000,000 = 1.6x

Private equity performance and Finary One
According to the France Invest x EY study for the end of 2025, the top quartile of French private equity funds delivered 22.0% a year over the decade, while the bottom quartile lost 7.6% a year. Dispersion is the main issue. Finary One gives investors with €1,000,000 in investable assets access to a selection of funds.
- Fund selection by type (small/mid-cap LBO, growth, secondaries, evergreen), with a personalised analysis of fees and each team's track record.
- A dedicated private banker who builds your private equity allocation (vintages, geographies, strategies) in line with your overall wealth and time horizon.
- A 360° view that tracks actual net performance (IRR, multiple, distributions) and feeds it into the management of your overall allocation.
Learn more about Finary One → Reserved for investors with €1,000,000 in investable assets. Investing carries risk, including the risk of capital loss. Past performance is not a reliable indicator of future performance.
What are private equity's historical returns, and what are the risks?
Private equity has historically delivered average annual returns of 10% to 15% depending on the region, with wide dispersion between managers and a real risk of capital loss.
In France: historical performance and trends
Between the end of 2015 and the end of 2025, the annualised net IRR reached 10.7%, well above the main national stock market indices.
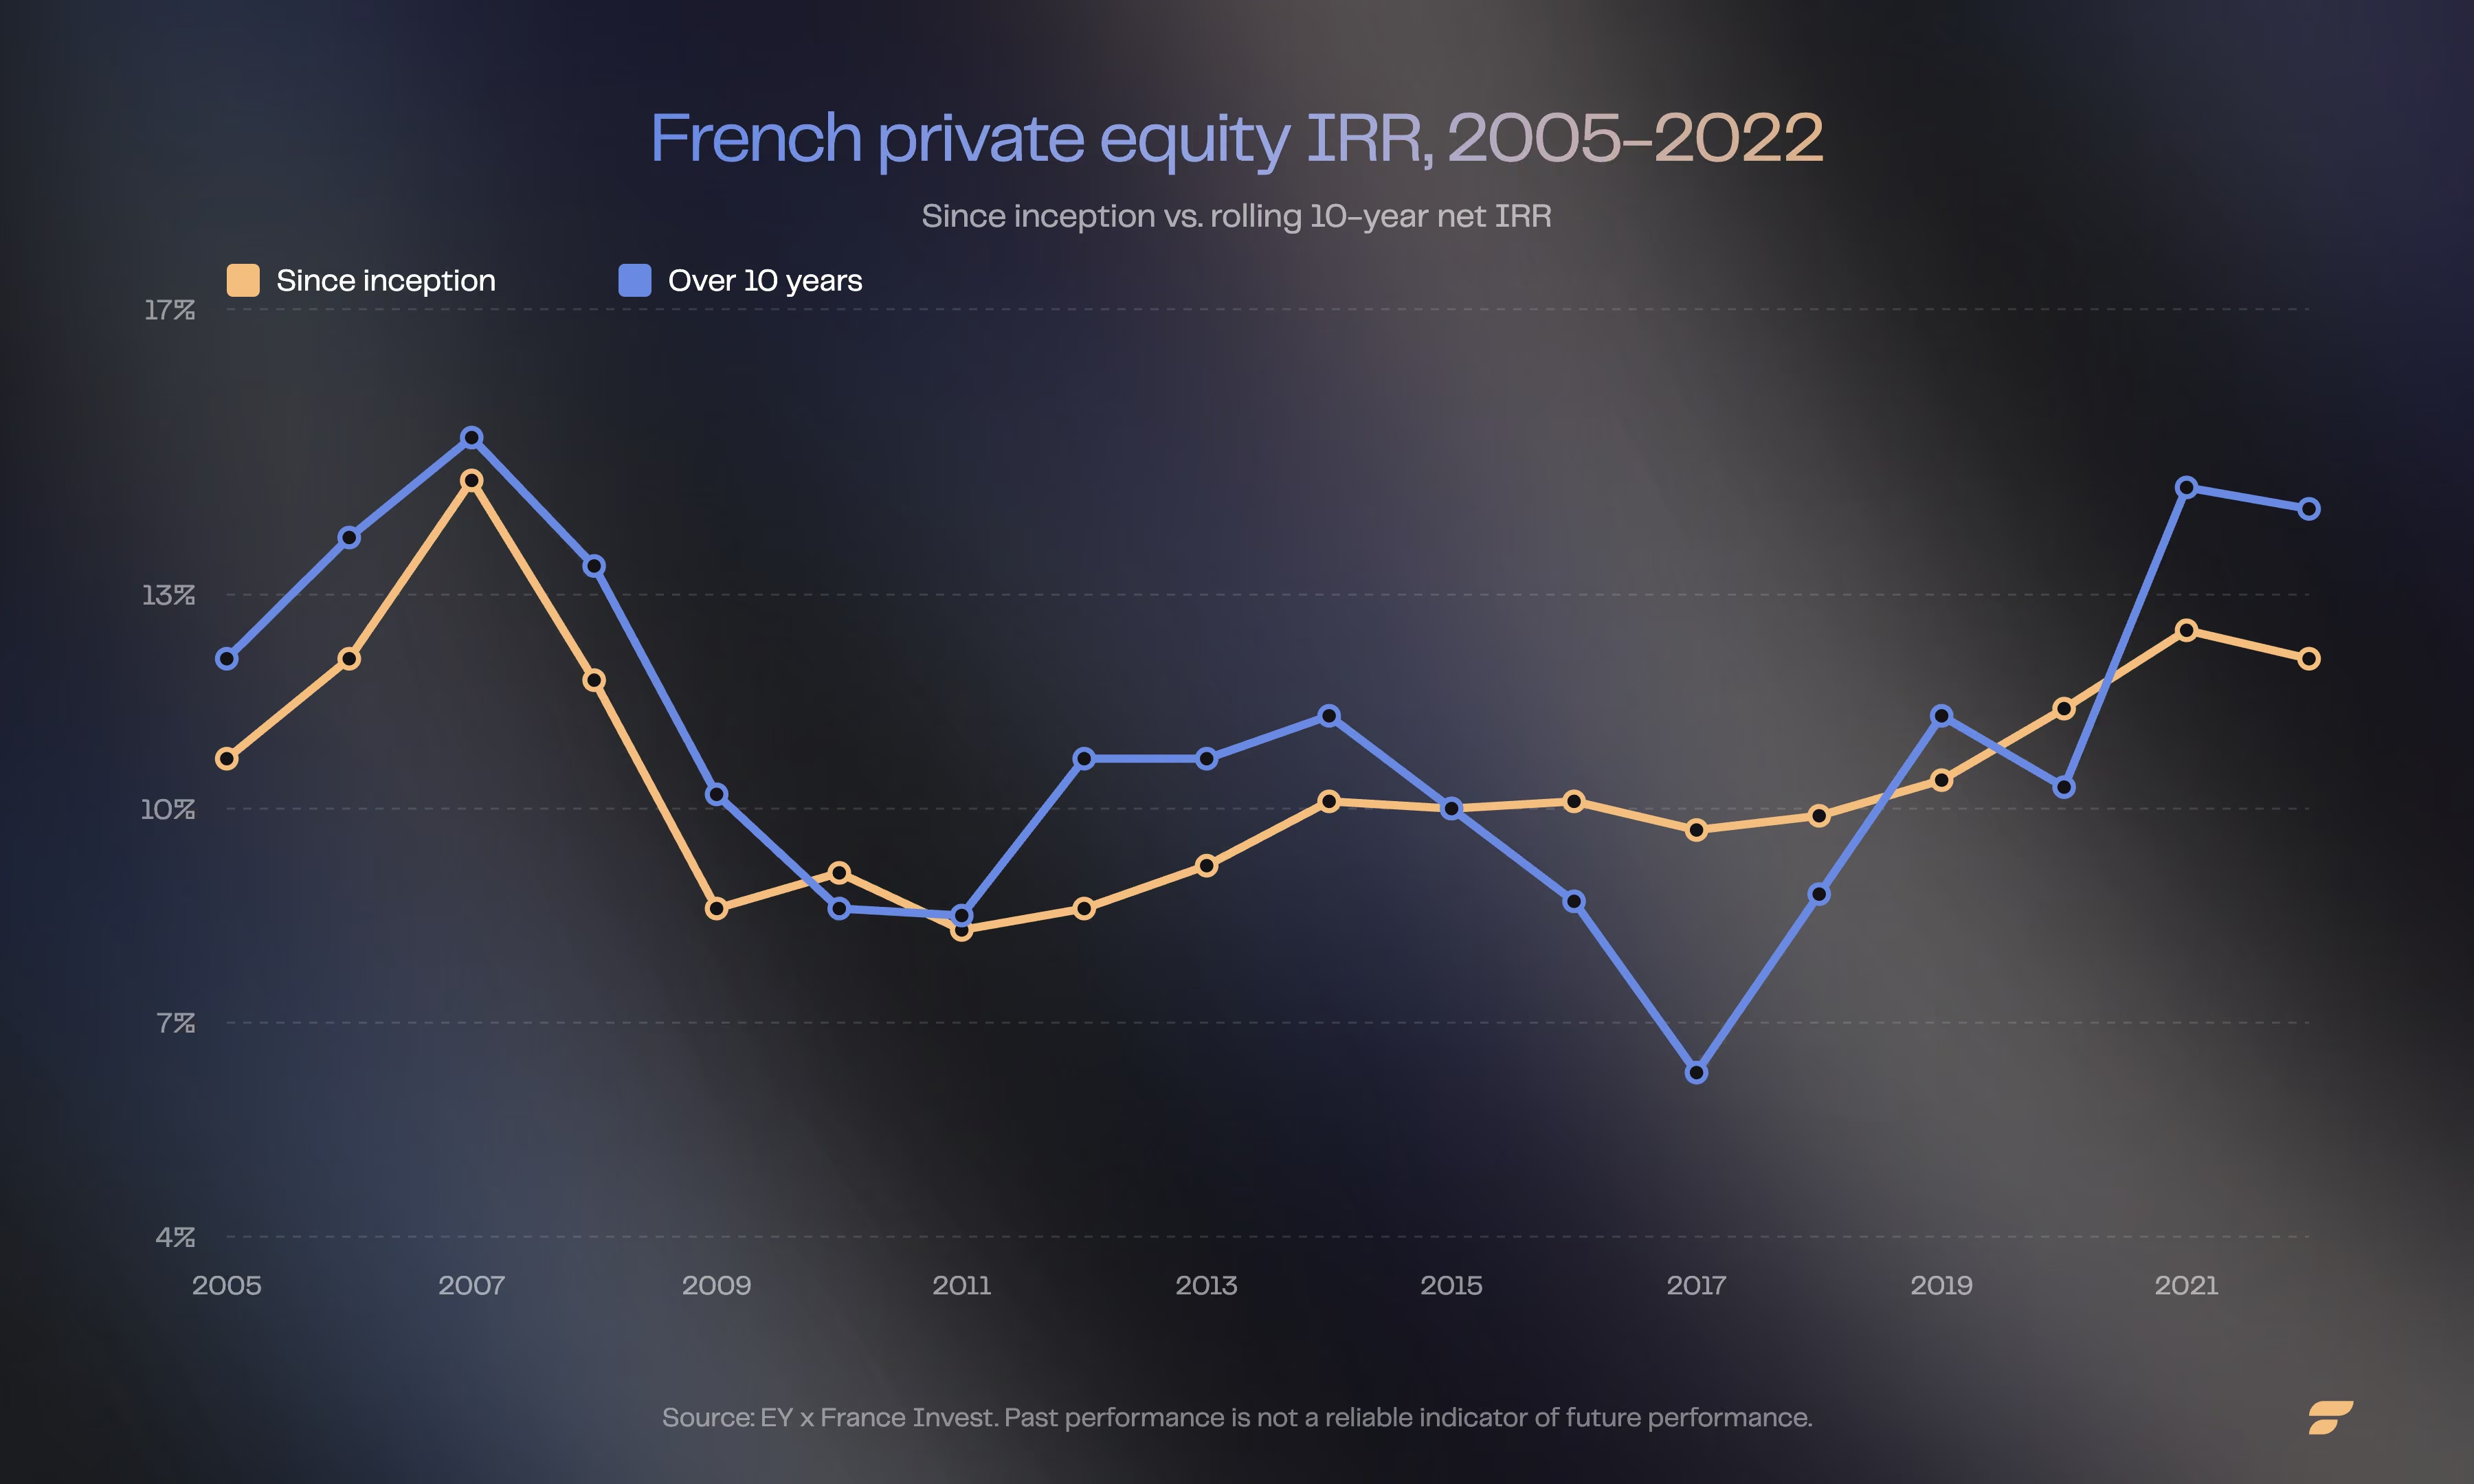
This structural resilience of French private equity is also confirmed across market cycles: performance (10-year net IRR) fell to 8.5% in 2009 after the financial shock, before rebounding vigorously, passing 14% as early as 2021-2022.
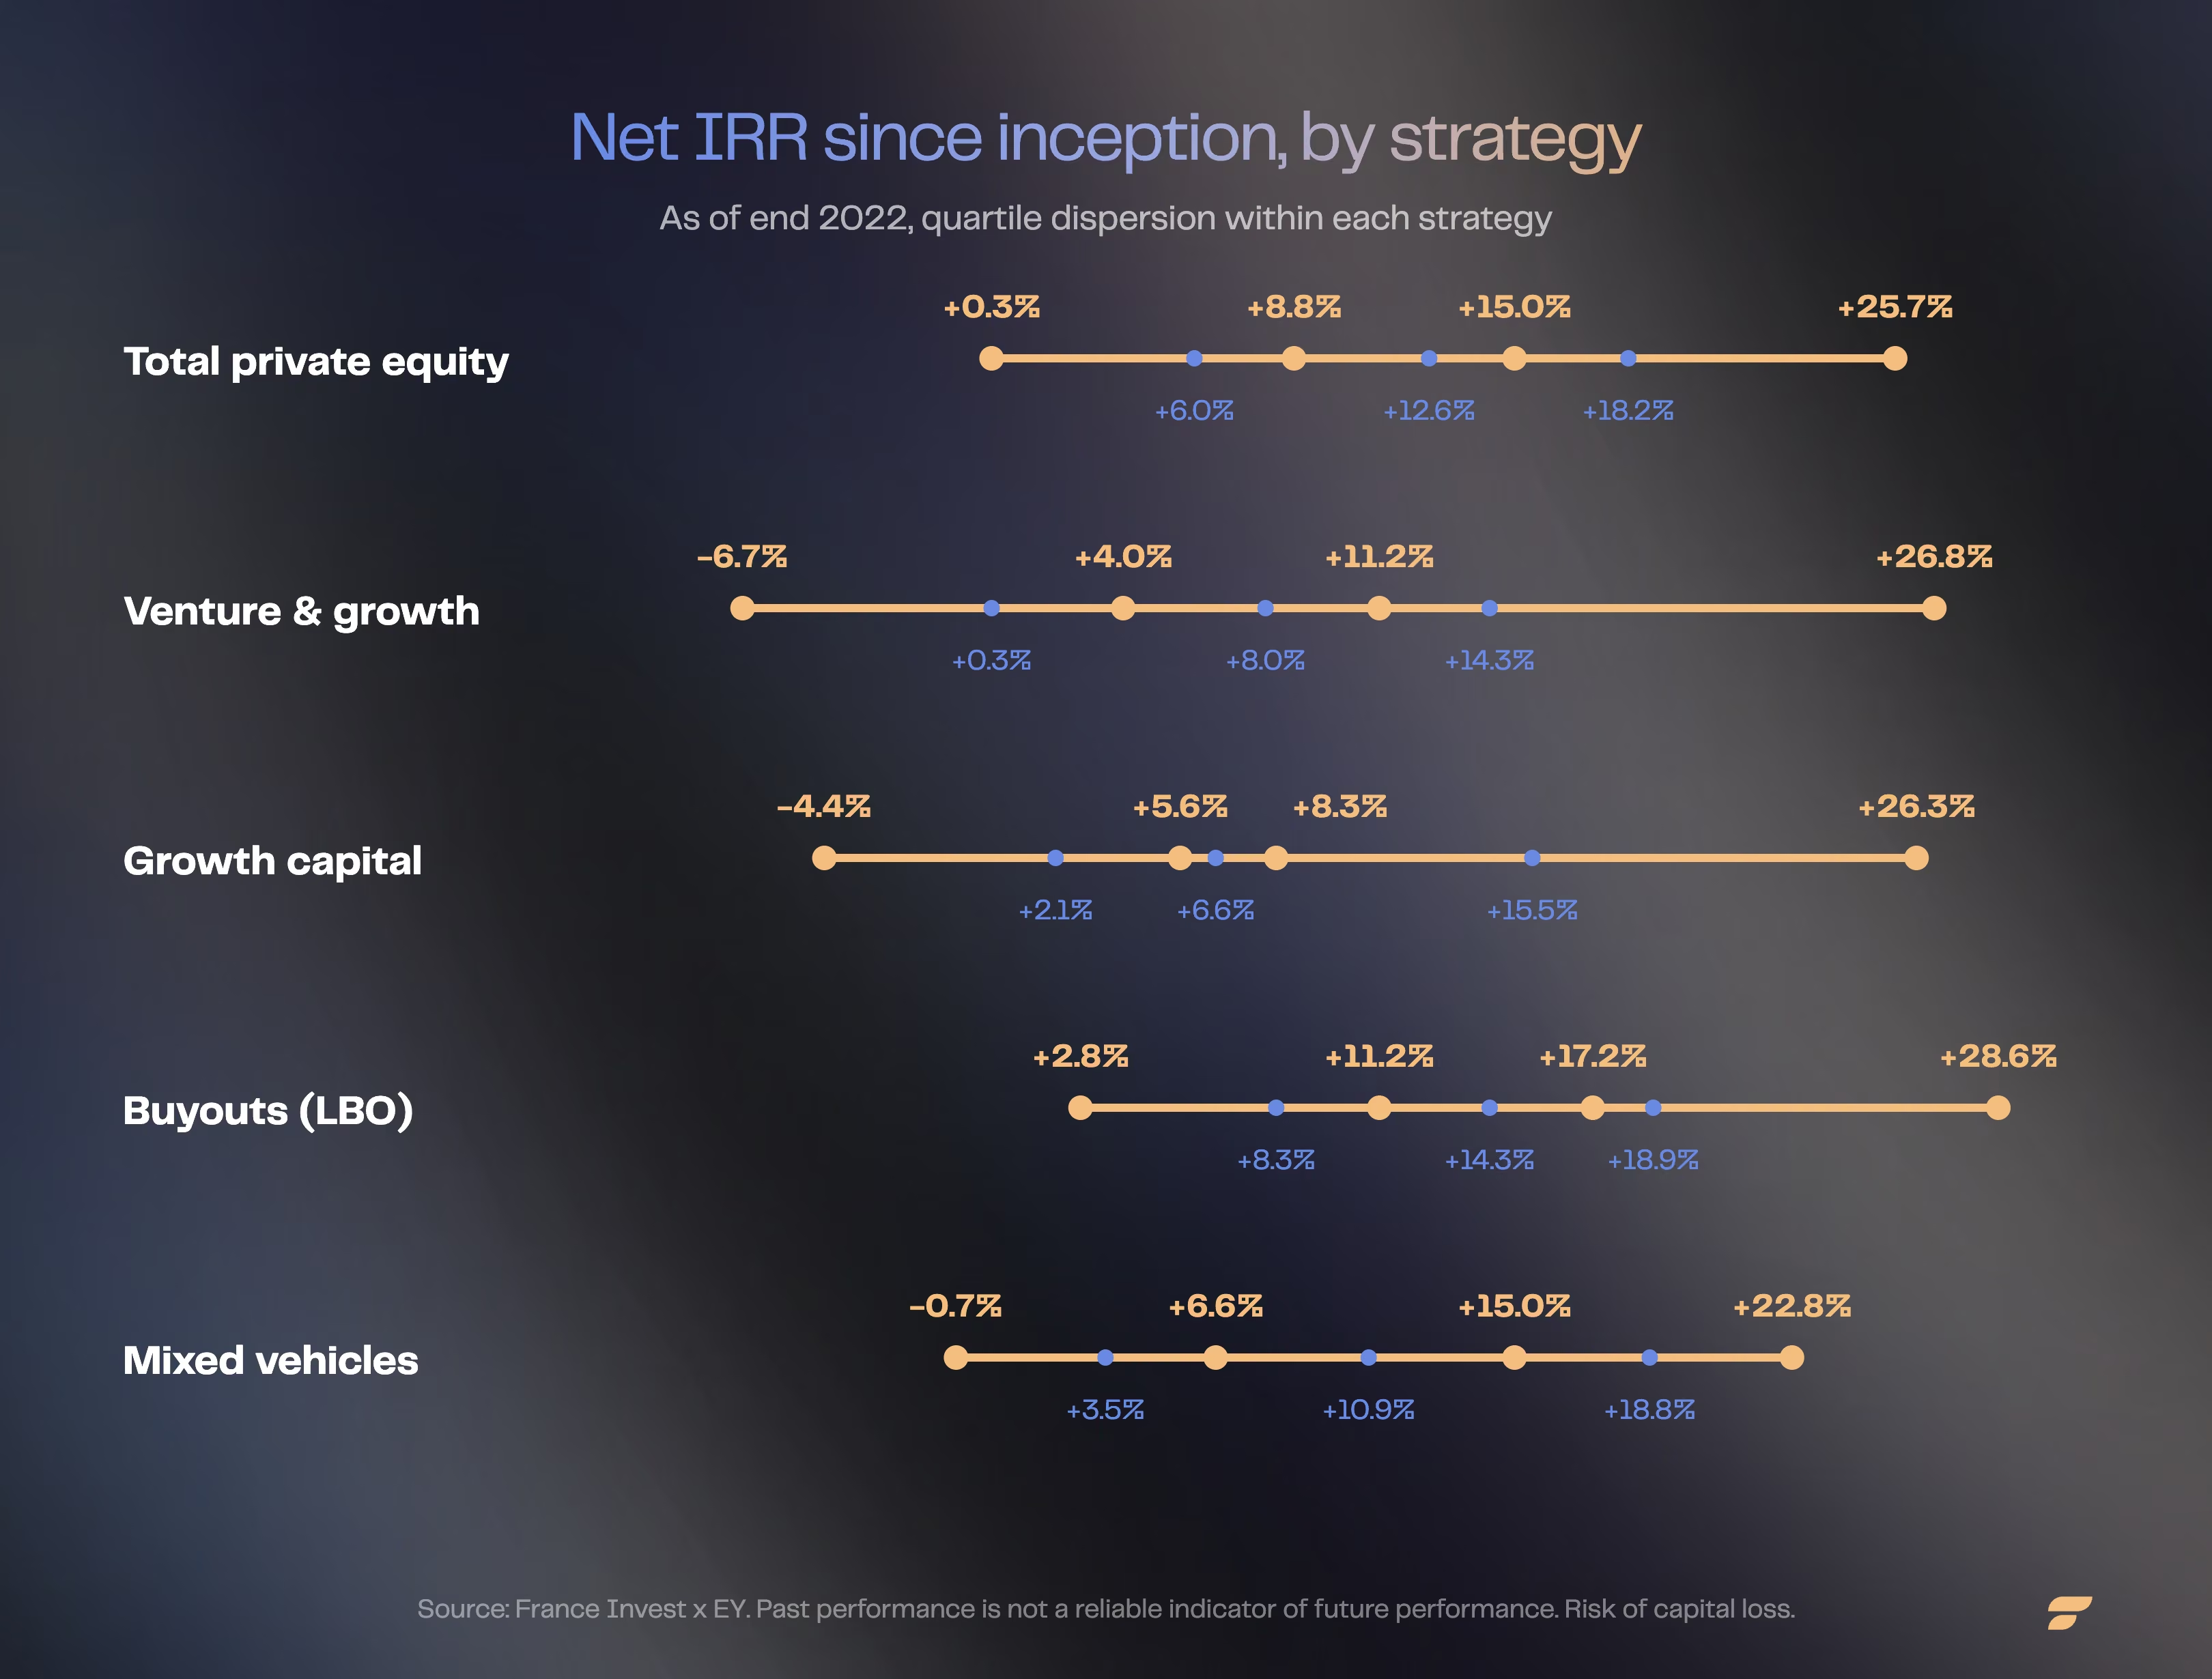
It is important to highlight the wide dispersion between managers. Over 10 years (to end of 2025), the top quartile of French funds posted a net IRR of 22.0%, while the bottom quartile could post a performance of -7.6%. Choosing the right fund and manager remains critical.
Internationally: a picture that varies with the economic cycle
Global private equity has historically maintained a robust performance track record, with average returns ranging between 10% and 15%. The industry now manages around $5.8 trillion in assets as of the end of 2023, including about $3.7 trillion of "dry powder" not yet deployed as of early 2026.
Aggregated data from Cambridge Associates show that global private equity has gone through several distinct cycles:
- 2000-2007: A golden period, with net IRRs regularly above 20%
- 2008-2012: Post-crisis compression of returns, IRR 8-12%
- 2013-2019: Gradual rebound, performance 15-17%
- 2020-2024: Volatility (pandemic and rising rates), average IRR 12-14%
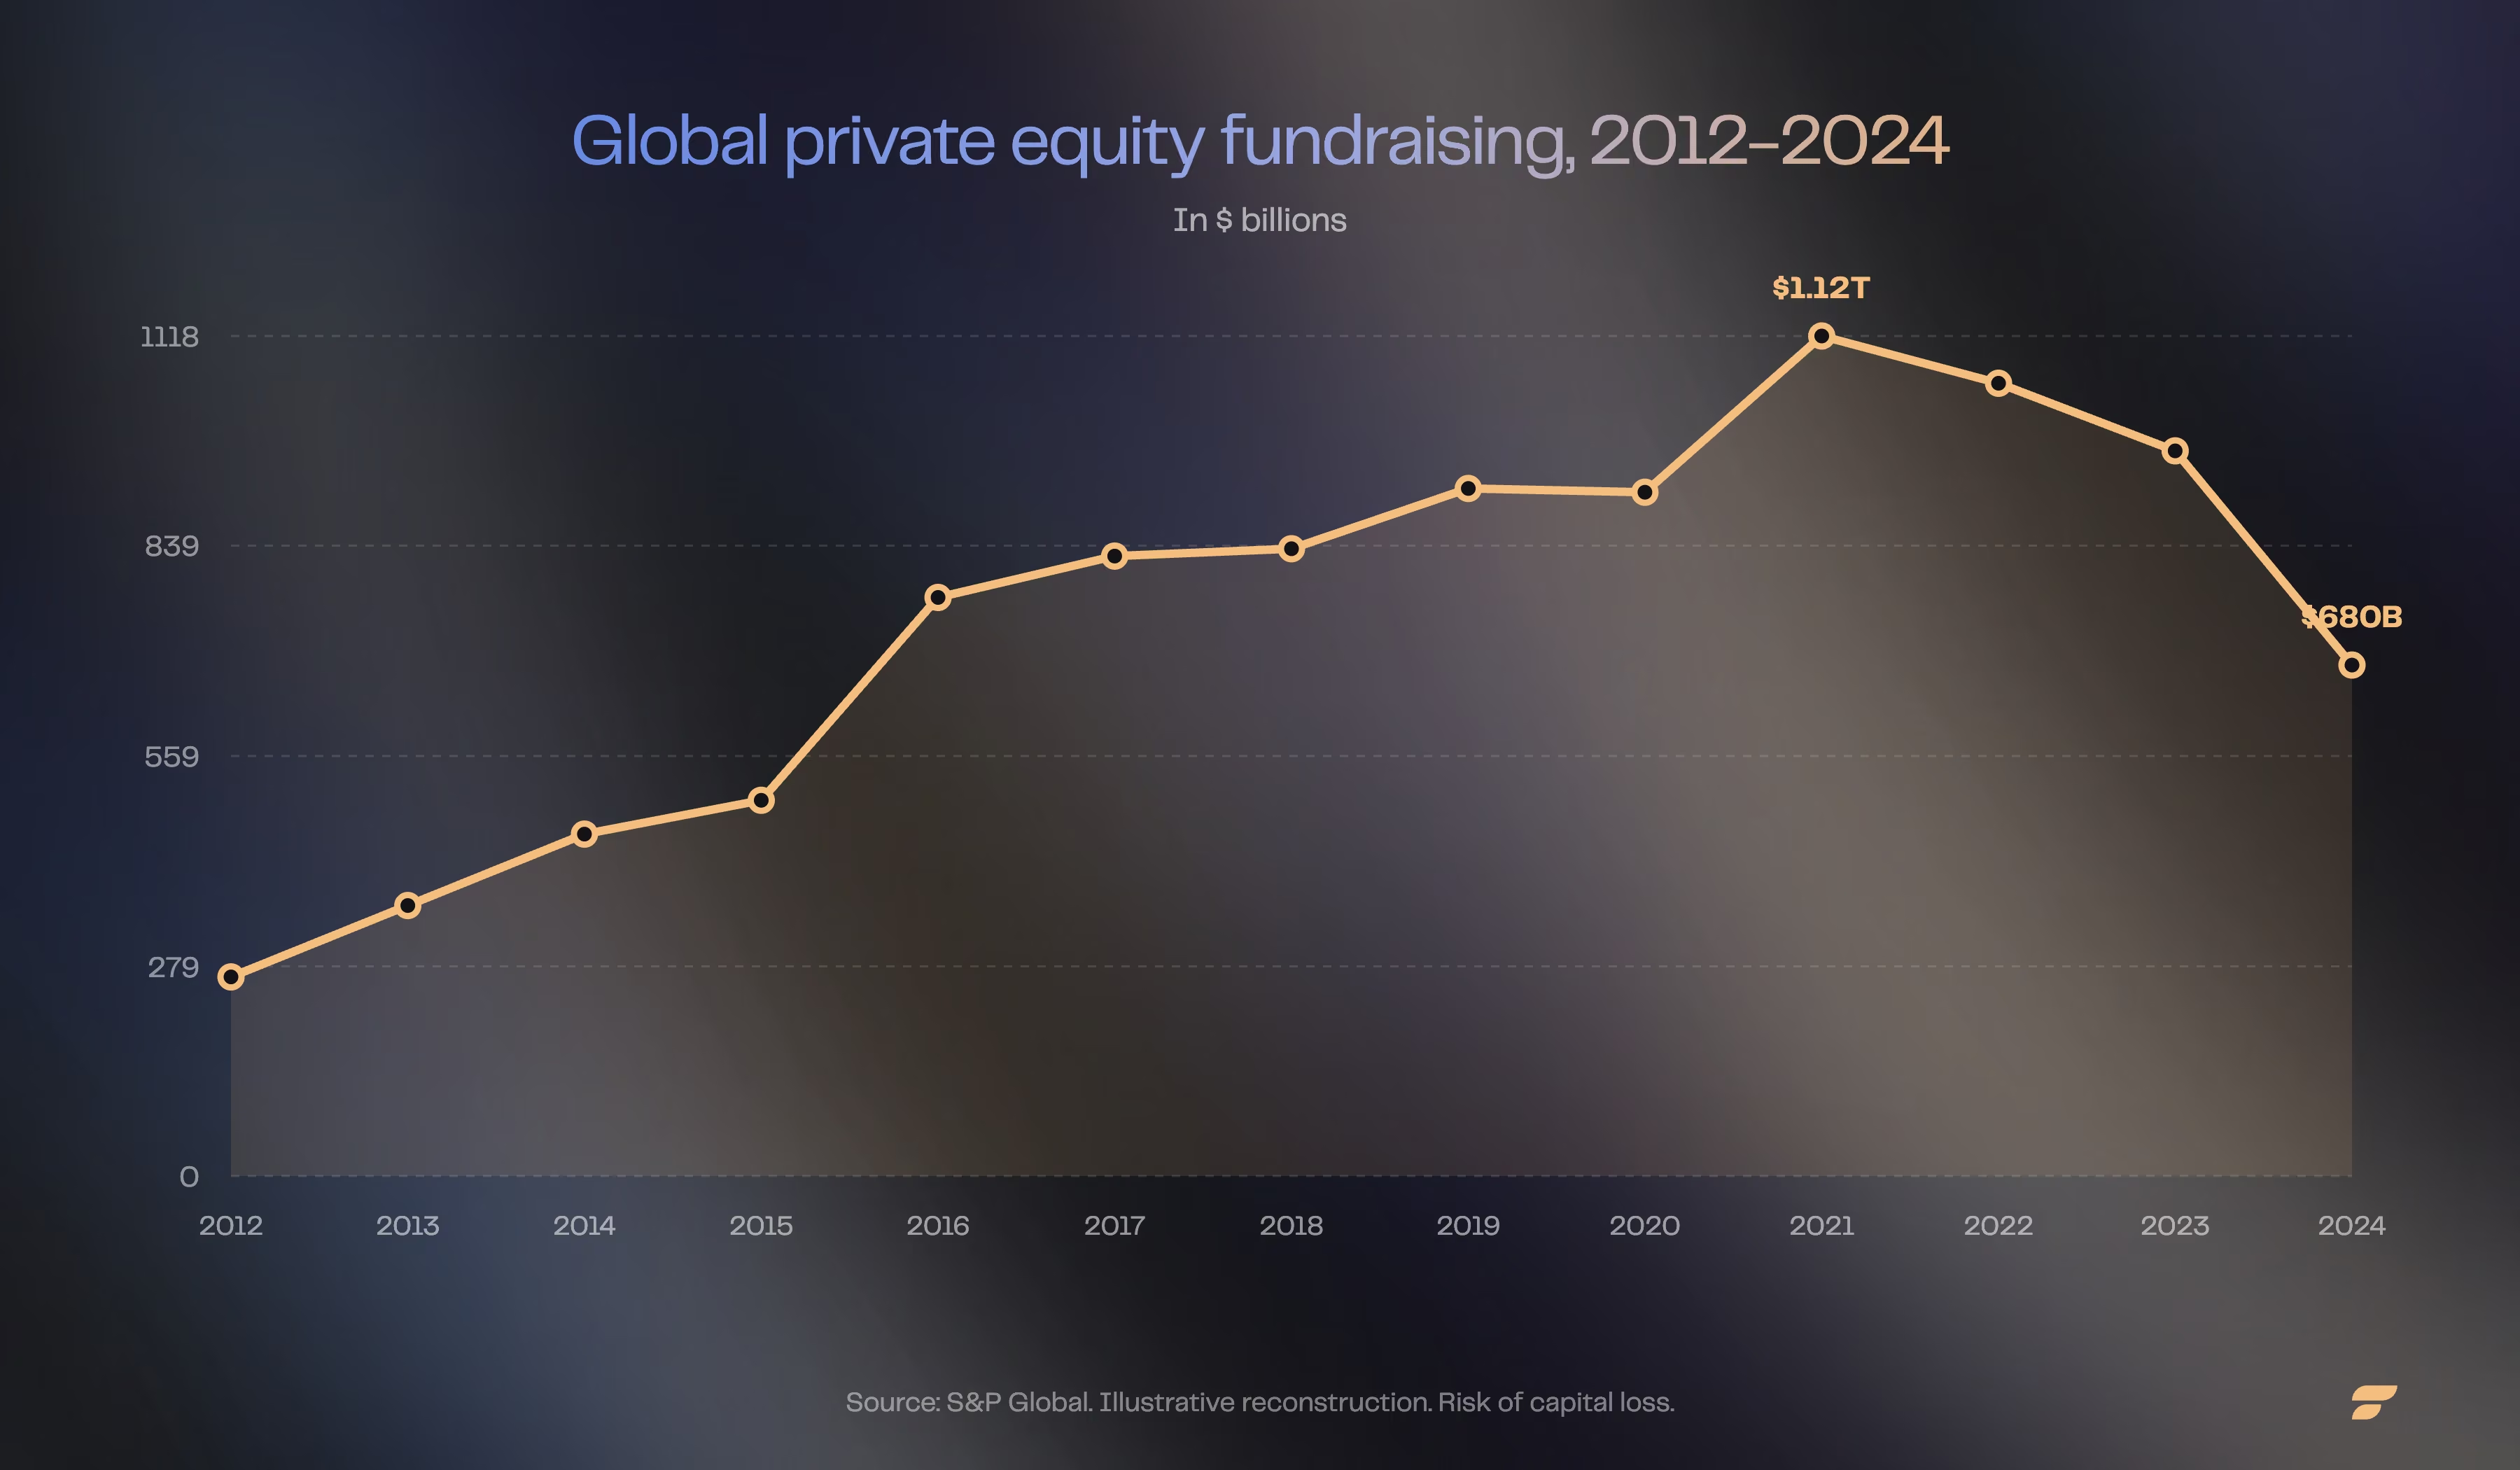
The United States remains the global leader, accounting for nearly 60% of assets under management. The annualised 10-year net IRR generally exceeds 15%.
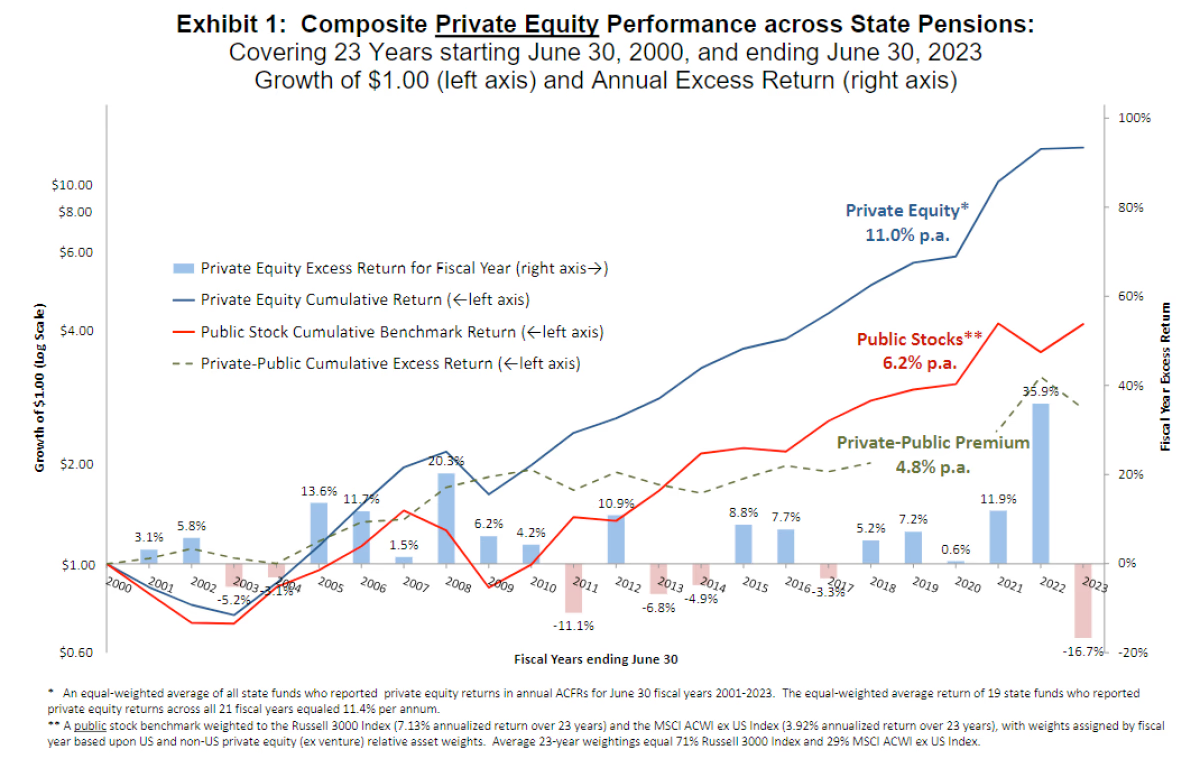
Europe shows more stability with flat performance, while Asia-Pacific stands out with 13% growth.

The risks of private equity
Private equity is built for patient investors. Funds stay locked up for 8 to 10 years, sometimes longer. The risk of capital loss is real: companies that fail, market downturns hitting valuations, and limited transparency.
Valuing portfolio companies is another challenge: the methods rely on assumptions that can differ significantly from the value actually realised at exit. In short, private equity demands rigour in fund selection and patience over time.
Understanding the performance levers in private equity
The impact of fees on net performance
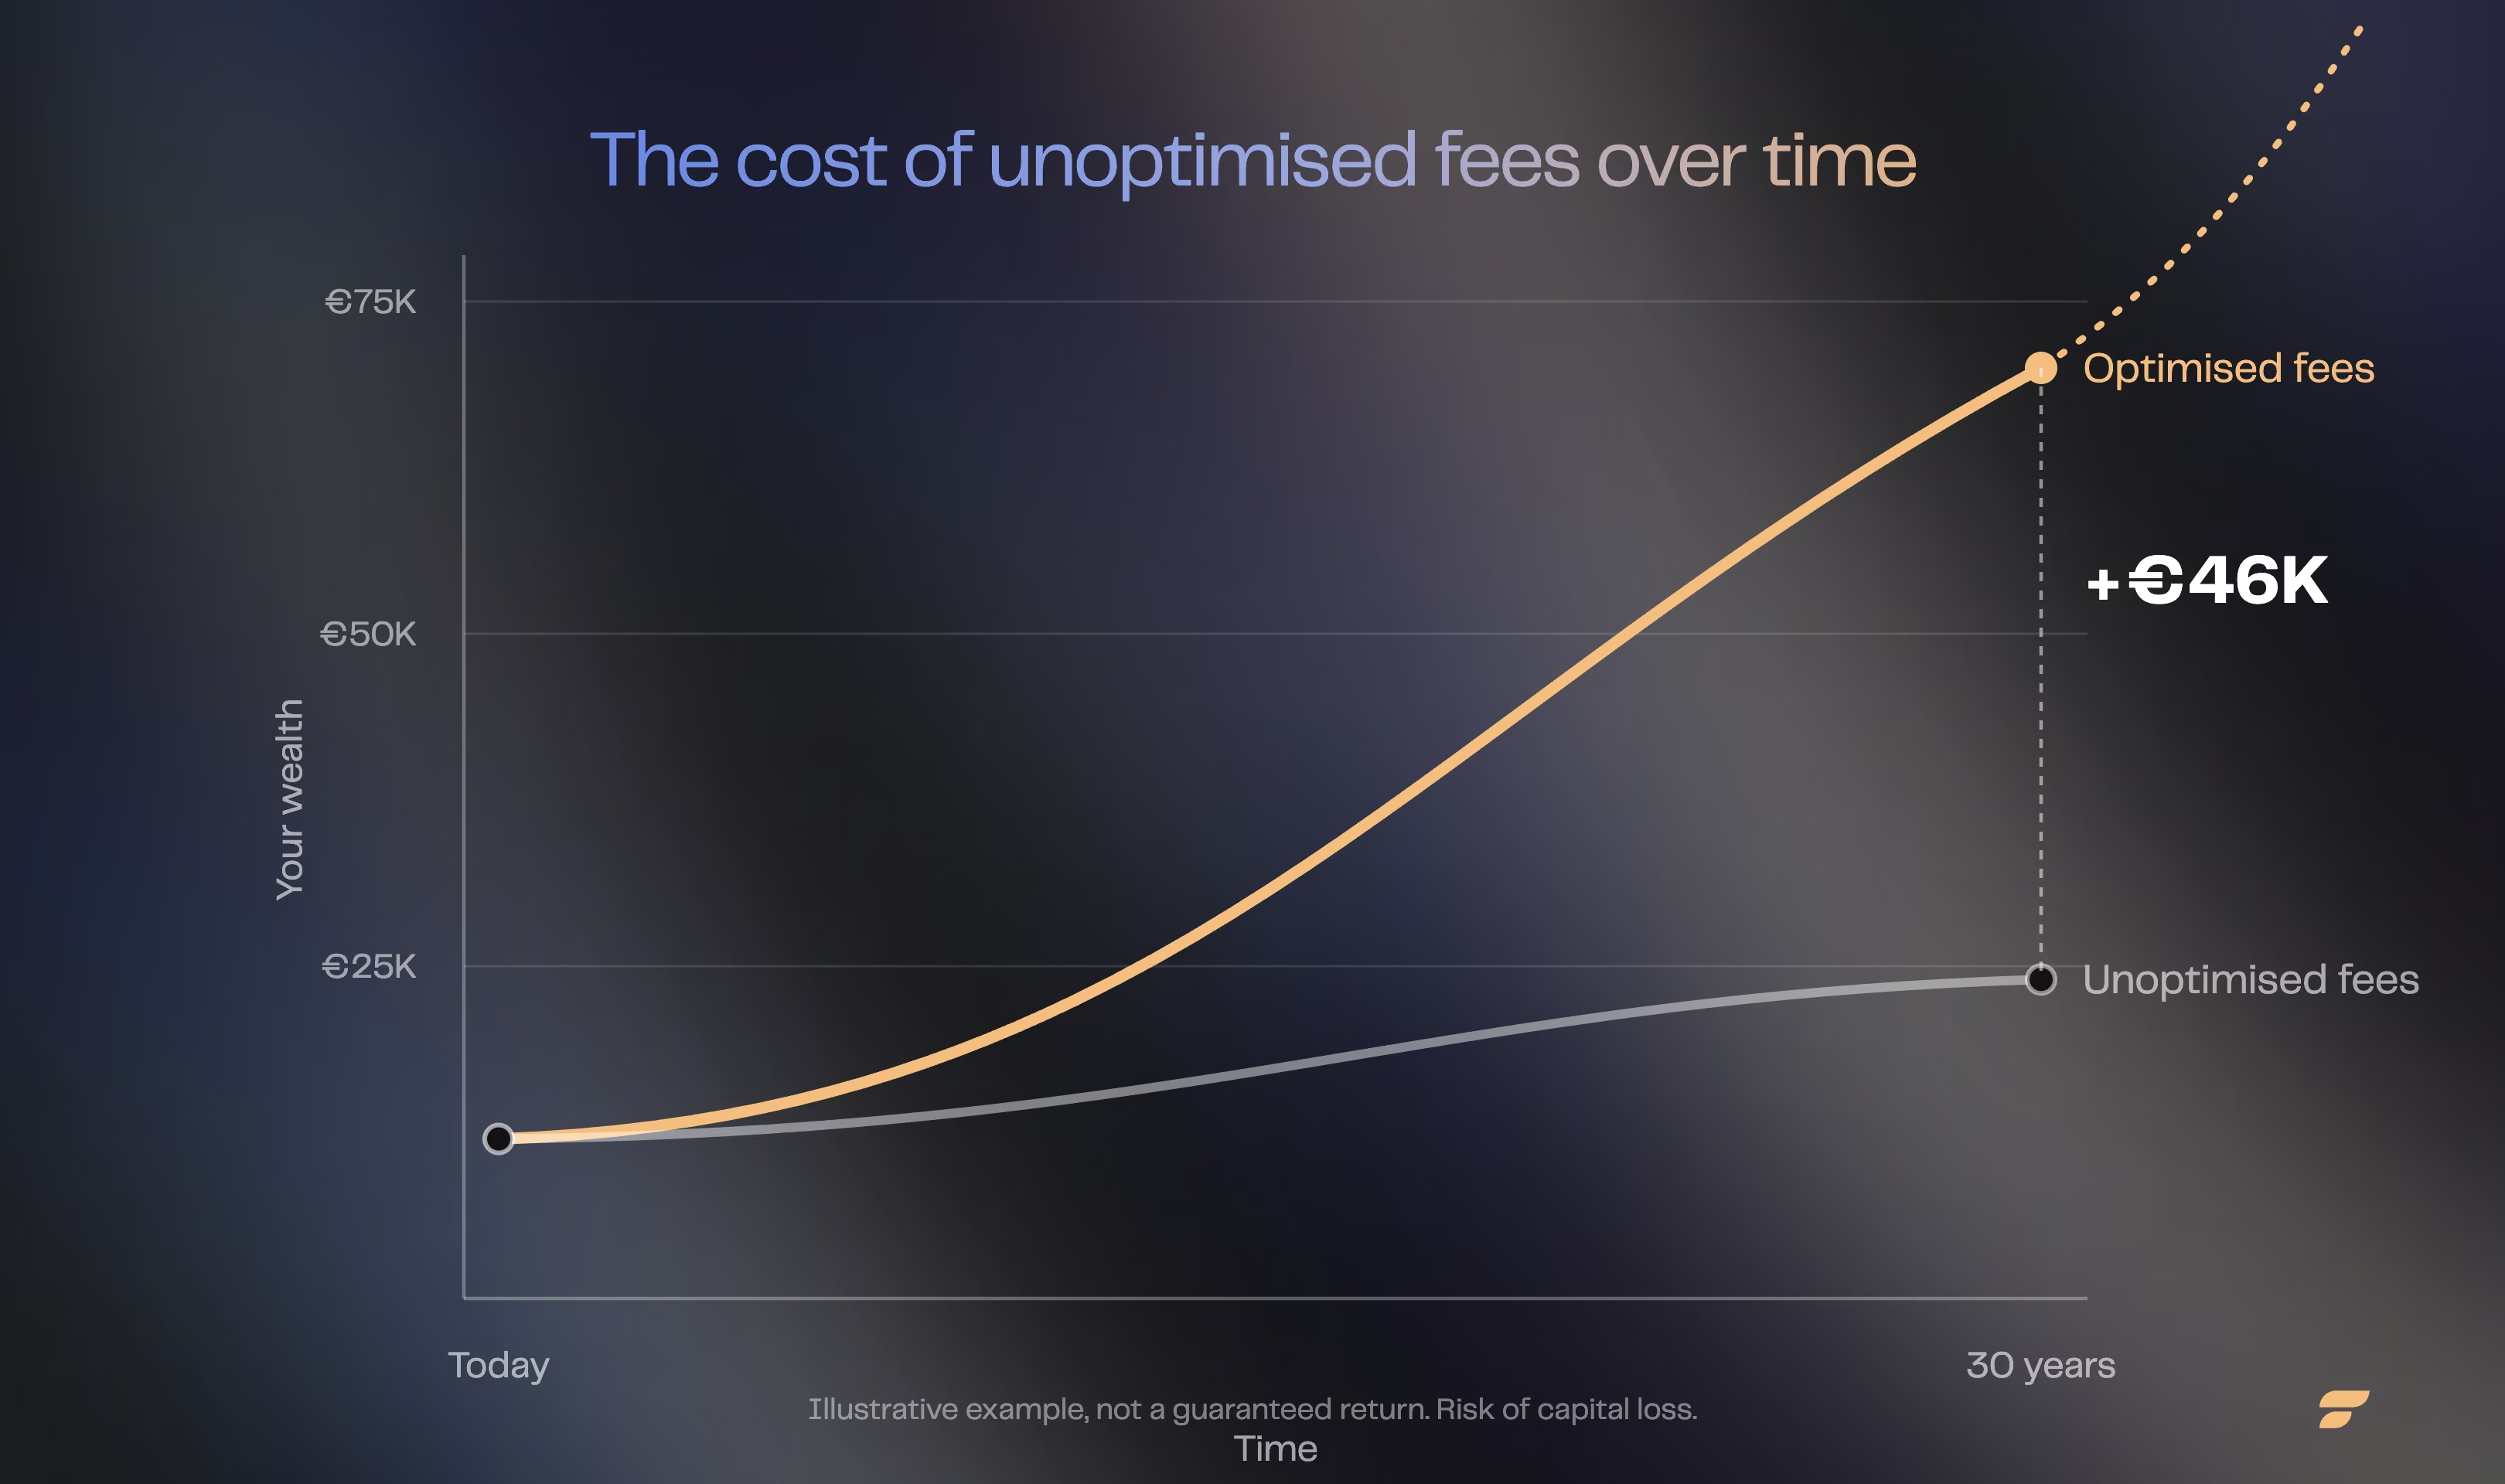
The two main types of fees are management fees (1.5% to 2.5% a year on committed capital) and carried interest (20% of the gains). Over ten years, they can absorb up to 20% of gross performance. A fund with a gross IRR of 18% may ultimately deliver a net IRR of 13% to 14%.
Careful investors therefore look at "net IRR", meaning IRR after all fees.
The influence of macroeconomic cycles and interest rates
When rates are low, the leverage used to finance acquisitions amplifies returns. Buyout funds then benefit from an environment where debt is cheap.
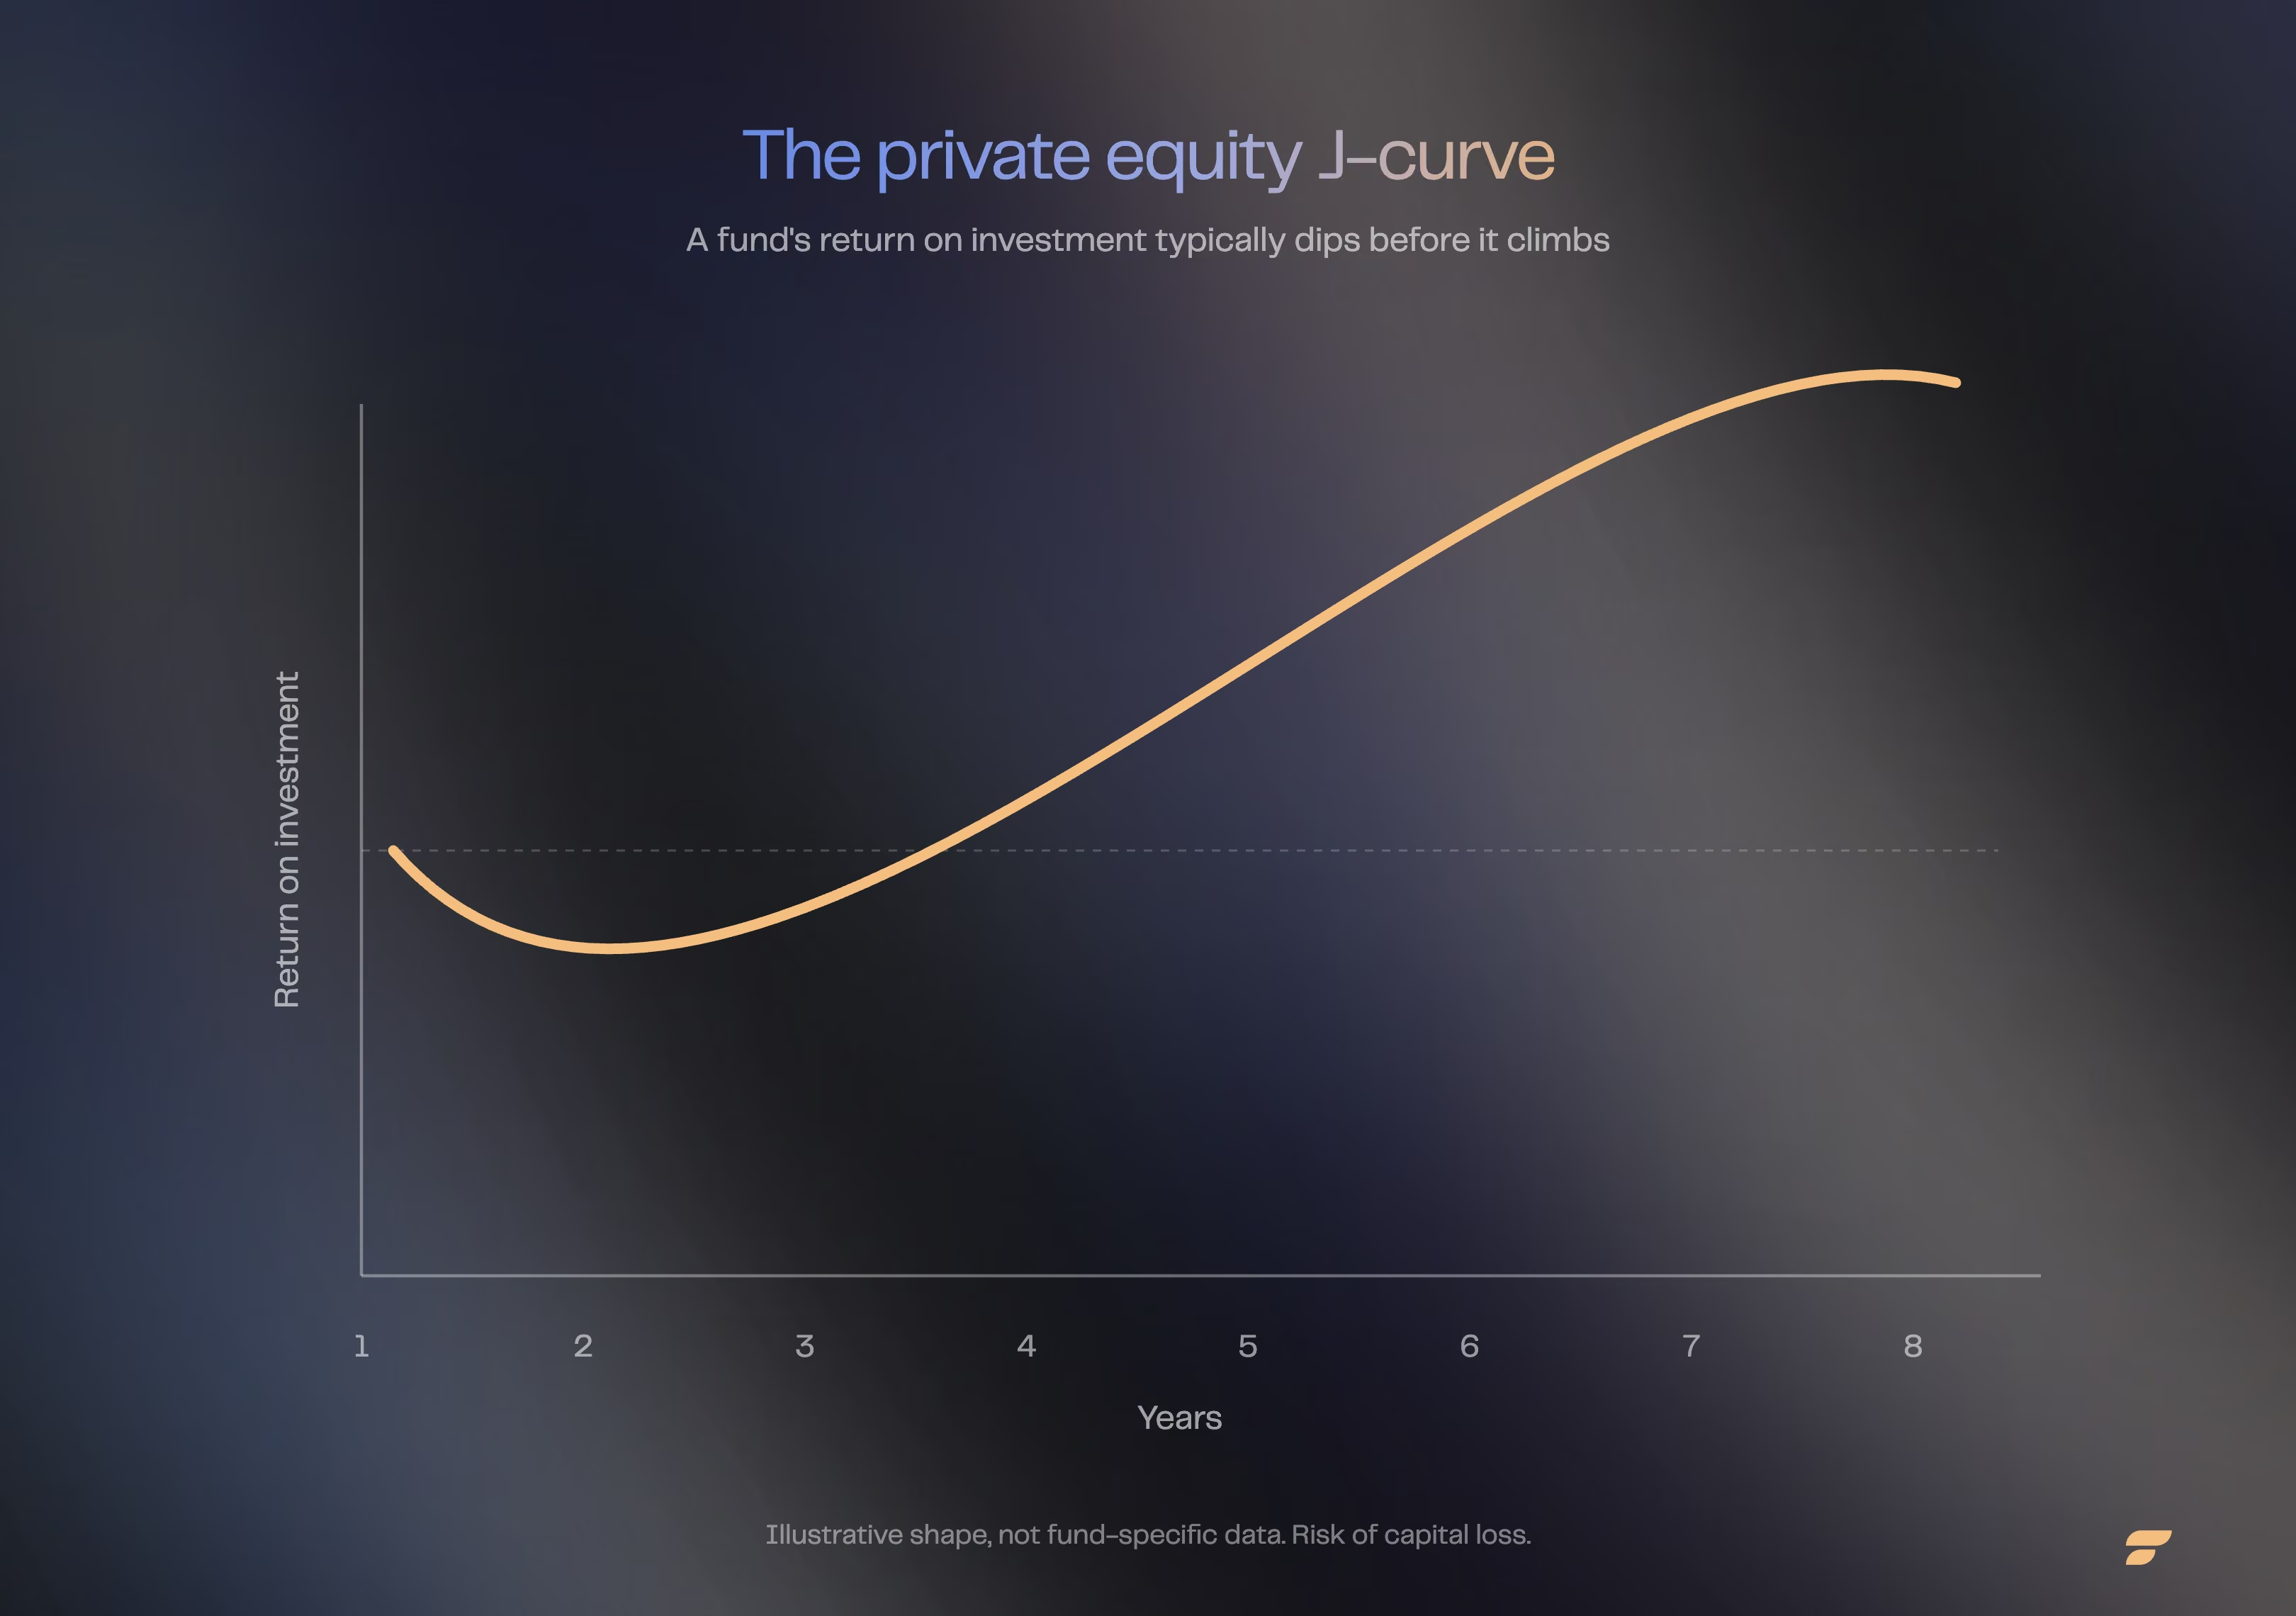
Since 2022, rising rates have pushed up the cost of debt, compressed valuation multiples and lengthened holding periods. Private equity's "J-curve" has become more pronounced.
Access strategies and diversification
Individual investors can invest through several vehicles: FCPR (Fonds Commun de Placement à Risques, a French regulated venture-capital fund), FPCI (Fonds Professionnel de Capital Investissement, its professional-investor counterpart), or Luxembourg life insurance policies.
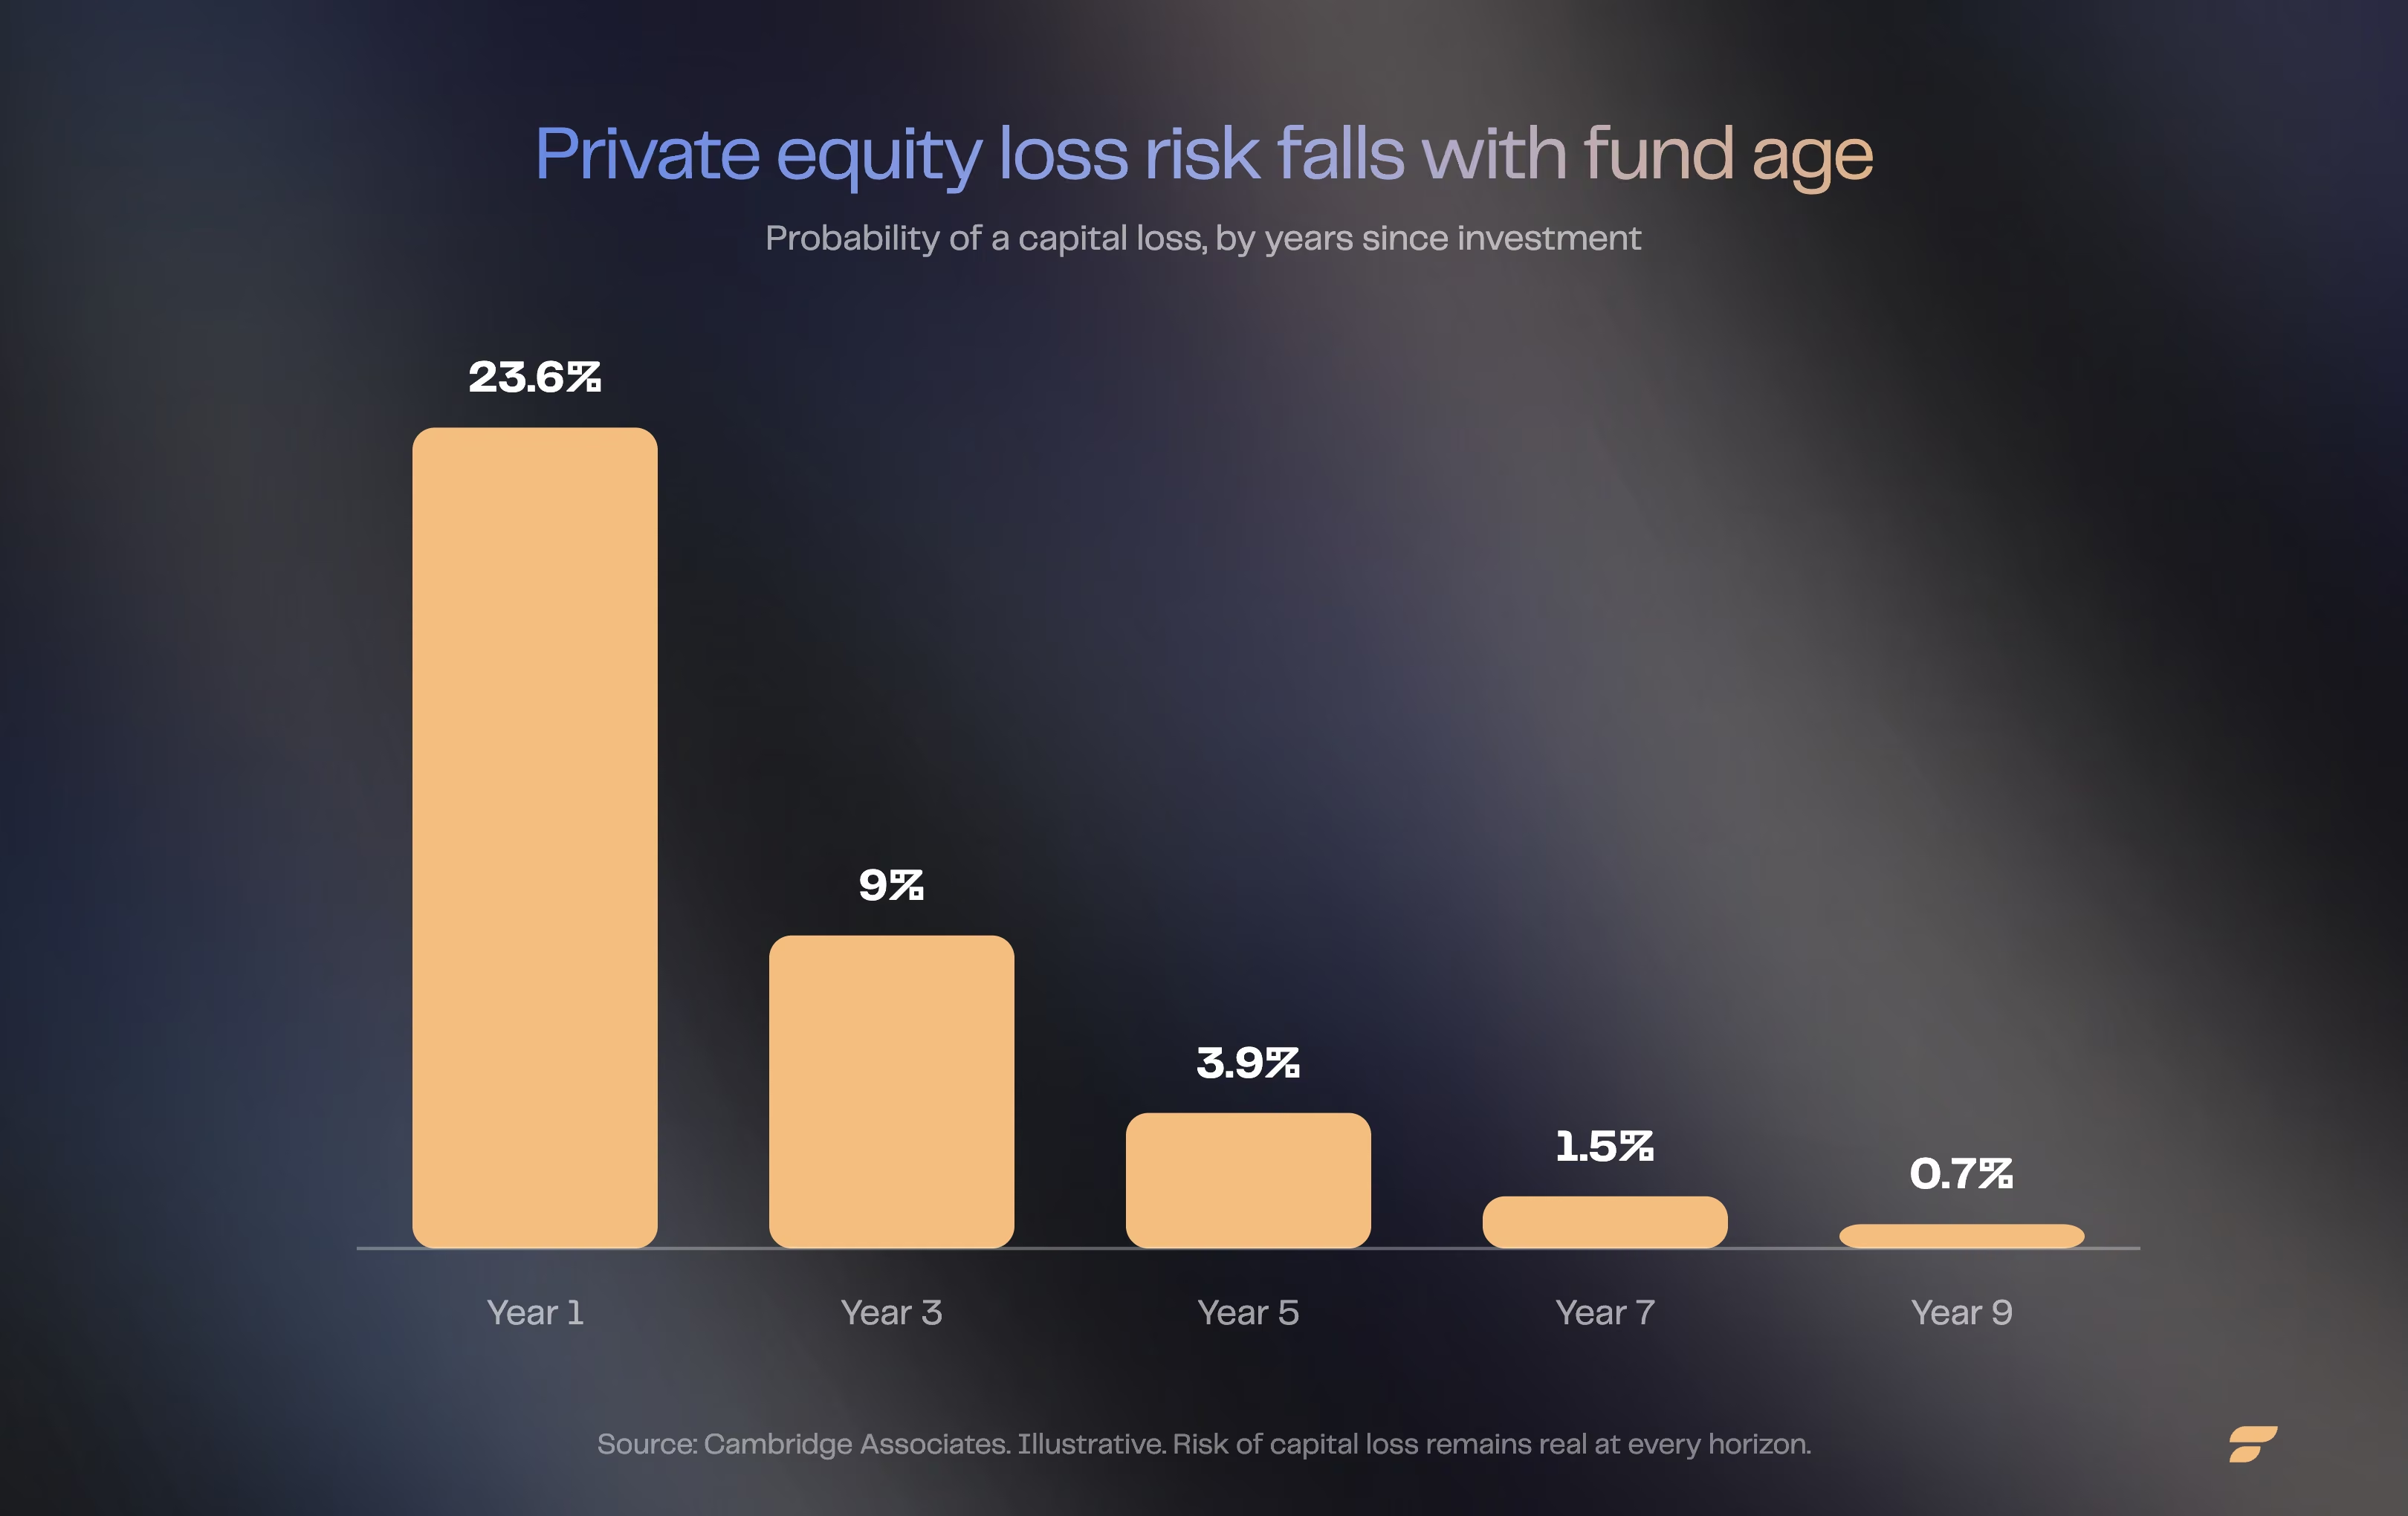
As an indication, some experienced investors consider a private equity allocation diversified across several funds to smooth out cycles. Any decision should be tailored to your personal situation and investment horizon. The gap between the top and bottom quartile is significant: over ten years, the top 25% of French managers posted a net IRR of 22.0%, versus -7.6% for the bottom quartile.
The future of your private equity investments
Mastering private equity performance requires a thorough understanding of economic cycles, rigorous manager selection, and a long-term view suited to your investor profile.
With the right metrics in hand and a well-thought-out diversification strategy, private equity can become part of a wealth-optimisation strategy, provided you accept its liquidity constraints and stay alert to the dispersion of performance between managers.
Frequently asked questions
What is a good IRR in private equity?
A net IRR above 12-15% a year is generally considered solid in private equity. In France, the average net IRR reaches 10.7% over 10 years, but the gap between the best and worst funds remains very wide depending on the manager chosen.
What is the difference between IRR and MOIC?
IRR measures an annualised rate of return that accounts for the exact timing of cash flows, while MOIC simply shows the multiple on invested capital, without factoring in time. A MOIC of 2x achieved in 3 years is a better result than the same multiple achieved in 8 years.
How do you calculate a private equity fund's TVPI?
TVPI (Total Value to Paid-In) is obtained by adding DPI, the cash already distributed relative to capital invested, and RVPI, the unrealised residual value relative to capital invested. A TVPI of 1.6x means the total value generated is 1.6 times the capital called.
How long does it take to see gains from a private equity fund?
Private equity funds typically lock up capital for 7 to 10 years. The early years often follow a J-curve, with temporarily negative valuations before exits generate positive distributions.
How can you access private equity with Finary One?
Finary One gives investors with at least €1,000,000 in investable assets access to a selection of private equity funds (small and mid-cap LBO, growth, secondaries, evergreen), with a dedicated private banker to build the allocation.
Is private equity riskier than the stock market?
Private equity carries a risk of capital loss, several years of illiquidity, and wide dispersion between managers. Unlike listed shares, it cannot be sold at any time, which calls for a long investment horizon and rigorous selection.
Sources
France Invest x EY, Net performance of French private equity, 32nd edition, data to end of 2025
Preqin, 2025 Global Private Equity Report, global assets under management and dry powder
France Invest, private equity glossary: definitions of IRR, TVPI, DPI, RVPI and MOIC
AMF white list of crypto-asset service providers (CASP), Finary SAS
Finary One, offer overview and access conditions
Regulatory disclaimers: Marketing communication. Investing carries a risk of partial or total capital loss. Past performance is not a reliable indicator of future performance. This article is for informational and educational purposes only; it does not constitute personalised investment advice, a recommendation to buy or sell, or tax advice. This investment carries a liquidity risk (no guaranteed resale, long horizon) and a risk of capital loss. Income and valuations are not guaranteed. Before investing, read the Key Information Document (KID) and, where relevant, consult an authorised adviser. Finary SAS, an investment firm authorised by the ACPR under no. 19283, member of AMAFI. Insurance broker registered with ORIAS under no. 21001279, member of the CNCGP (association approved by the AMF). Crypto-Asset Service Provider (CASP) authorised by the AMF under the MiCA regime, references no. A2026-026 and no. N2026-008.