


Investment Fees in France: How Much Are They Really Costing You?

Updated on 28 July 2026
Fees make fortunes for your bank, your advisor, and countless financial intermediaries in France. Yet nobody talks about them.
Don't believe it? 3% in fees per year is close to 60% of lost returns over 30 years. This article breaks down the numbers and the method for shedding your fees and maximising your wealth.

- Fees stack in three layers: the wrapper (life insurance, PEA, PER), the investment options (funds, ETFs) and the management, plus transaction fees.
- 3% in annual fees means giving up close to 60% of your potential returns over 30 years: compound interest works against you.
- According to the SPIVA study, more than 80% of active managers fail to beat their benchmark index over more than 5 years, despite charging 10 times more than an ETF.
- On €10,000 invested over 30 years, a policy charging 3% in fees can cost more in fees (€57,000) than it accumulates in capital (€43,000).
- Your intermediary is legally required to disclose all of its fees, under the European MiFID II directive.
Why are fees the investor's public enemy number one?
Because they are everywhere, cumulative and compounding: every investment carries fees that pay the companies involved in the transaction.
Whether you buy shares through your PEA (a French tax-advantaged equity savings account), an ETF through your life insurance policy, or a fund through your PER (France's retirement savings plan), you pay fees. They hide at every level and under different names: commissions, management fees, processing fees, spreads, retrocessions. Let's be clear: fees are an indigestible layer cake.
Expressed as a percentage, they look insignificant. What difference does 2% a year on a fund or 1% for a managed-portfolio service really make? The impact is nonetheless considerable, for three reasons:
- the different layers stack up, so your fees add up;
- the lost returns accelerate over time: it is compound interest, but working against you;
- these fees are generally unjustified and avoidable.
The subject is serious enough that the AMF, France's stock market watchdog, regularly publishes studies on these fees and their impact on individual investors' savings.
"Performance comes and goes, but fees are always there."
Warren Buffett
What are the three layers of fees?
Before diving into the details, here are the three layers you absolutely need to know, plus a fourth that cuts across all of them.
The wrapper layer. The container that holds your investment options: life insurance, PEA, securities account, PER, company savings plan (PEE). It carries fixed and variable fees: contribution fees, switching fees, account-maintenance fees, exit fees. Our guide on which tax wrapper to choose compares them.
The investment-options layer. The instruments held inside the wrapper (funds, ETFs, SCPI, a French non-listed real-estate investment fund comparable to a REIT) charge annual fees expressed via the TER (Total Expense Ratio, or ongoing charges), deducted directly from the value of your units, which makes them easy to miss. Two categories:
- Active funds: the manager tries to beat the market, represented by its benchmark index, and typically charges 1.5% to 3% a year. The problem: according to the SPIVA study, more than 80% of active managers fail to beat their index over the long run (more than 5 years). You pay 2% to do worse than an ETF that costs 10 times less. Past performance is not a reliable indicator of future performance.
- Passive funds, including ETFs: their only objective is to replicate their index. With no active management, they typically cost between 0.1% and 0.5% a year.
Good to know: direct stock holdings do not carry investment-option fees.
The management layer. Delegating the management of your wrapper to a professional (a managed-portfolio service or discretionary management) comes at an extra cost.
Transaction fees. Every purchase or sale of a stock, a fund or a crypto asset costs money: the more trades you make, the more you chip away at your performance. Also watch the execution price: paying 0% in fees but buying 2% above the price on other exchanges amounts to the same thing.
How much do fees cost over 30 years?
Let's compare two life insurance policies, the wrapper French savers prefer above all others, with around 18 million policyholders, 54 million policies and more than €1.8 trillion invested (figures cited in the source video).
Option 1 is a classic policy from a major bank (example used: HSBC Stratégie Patrimoine Vie 2, fees as recorded at the end of 2023, representative of the category). Option 2 is an online life insurance policy, 100% ETF, under self-directed management.
| Fee layer | Traditional bank policy | 100% ETF online policy |
|---|---|---|
| Wrapper | 0.75% per year (+ 1.50% on each contribution) | 0.6% per year |
| Investment options | 2% on average (active funds) | 0.3% on average (ETFs) |
| Management | 0.6% (delegated management) | 0% (self-directed management) |
| Annual total | About 3% | About 1% |
Fees as recorded at the end of 2023 on the policy documents. The bank policy's total is deliberately understated.
Let's start with €10,000 invested as a lump sum, with 8% annual performance, the historical average for equity markets. Past performance is not a reliable indicator of future performance.
With the 3%-fee policy, you end up with €43,000 in capital. Not bad? It is catastrophic: you will have paid €57,000 in fees over the period. You are not dreaming: more paid in fees than accumulated in capital.
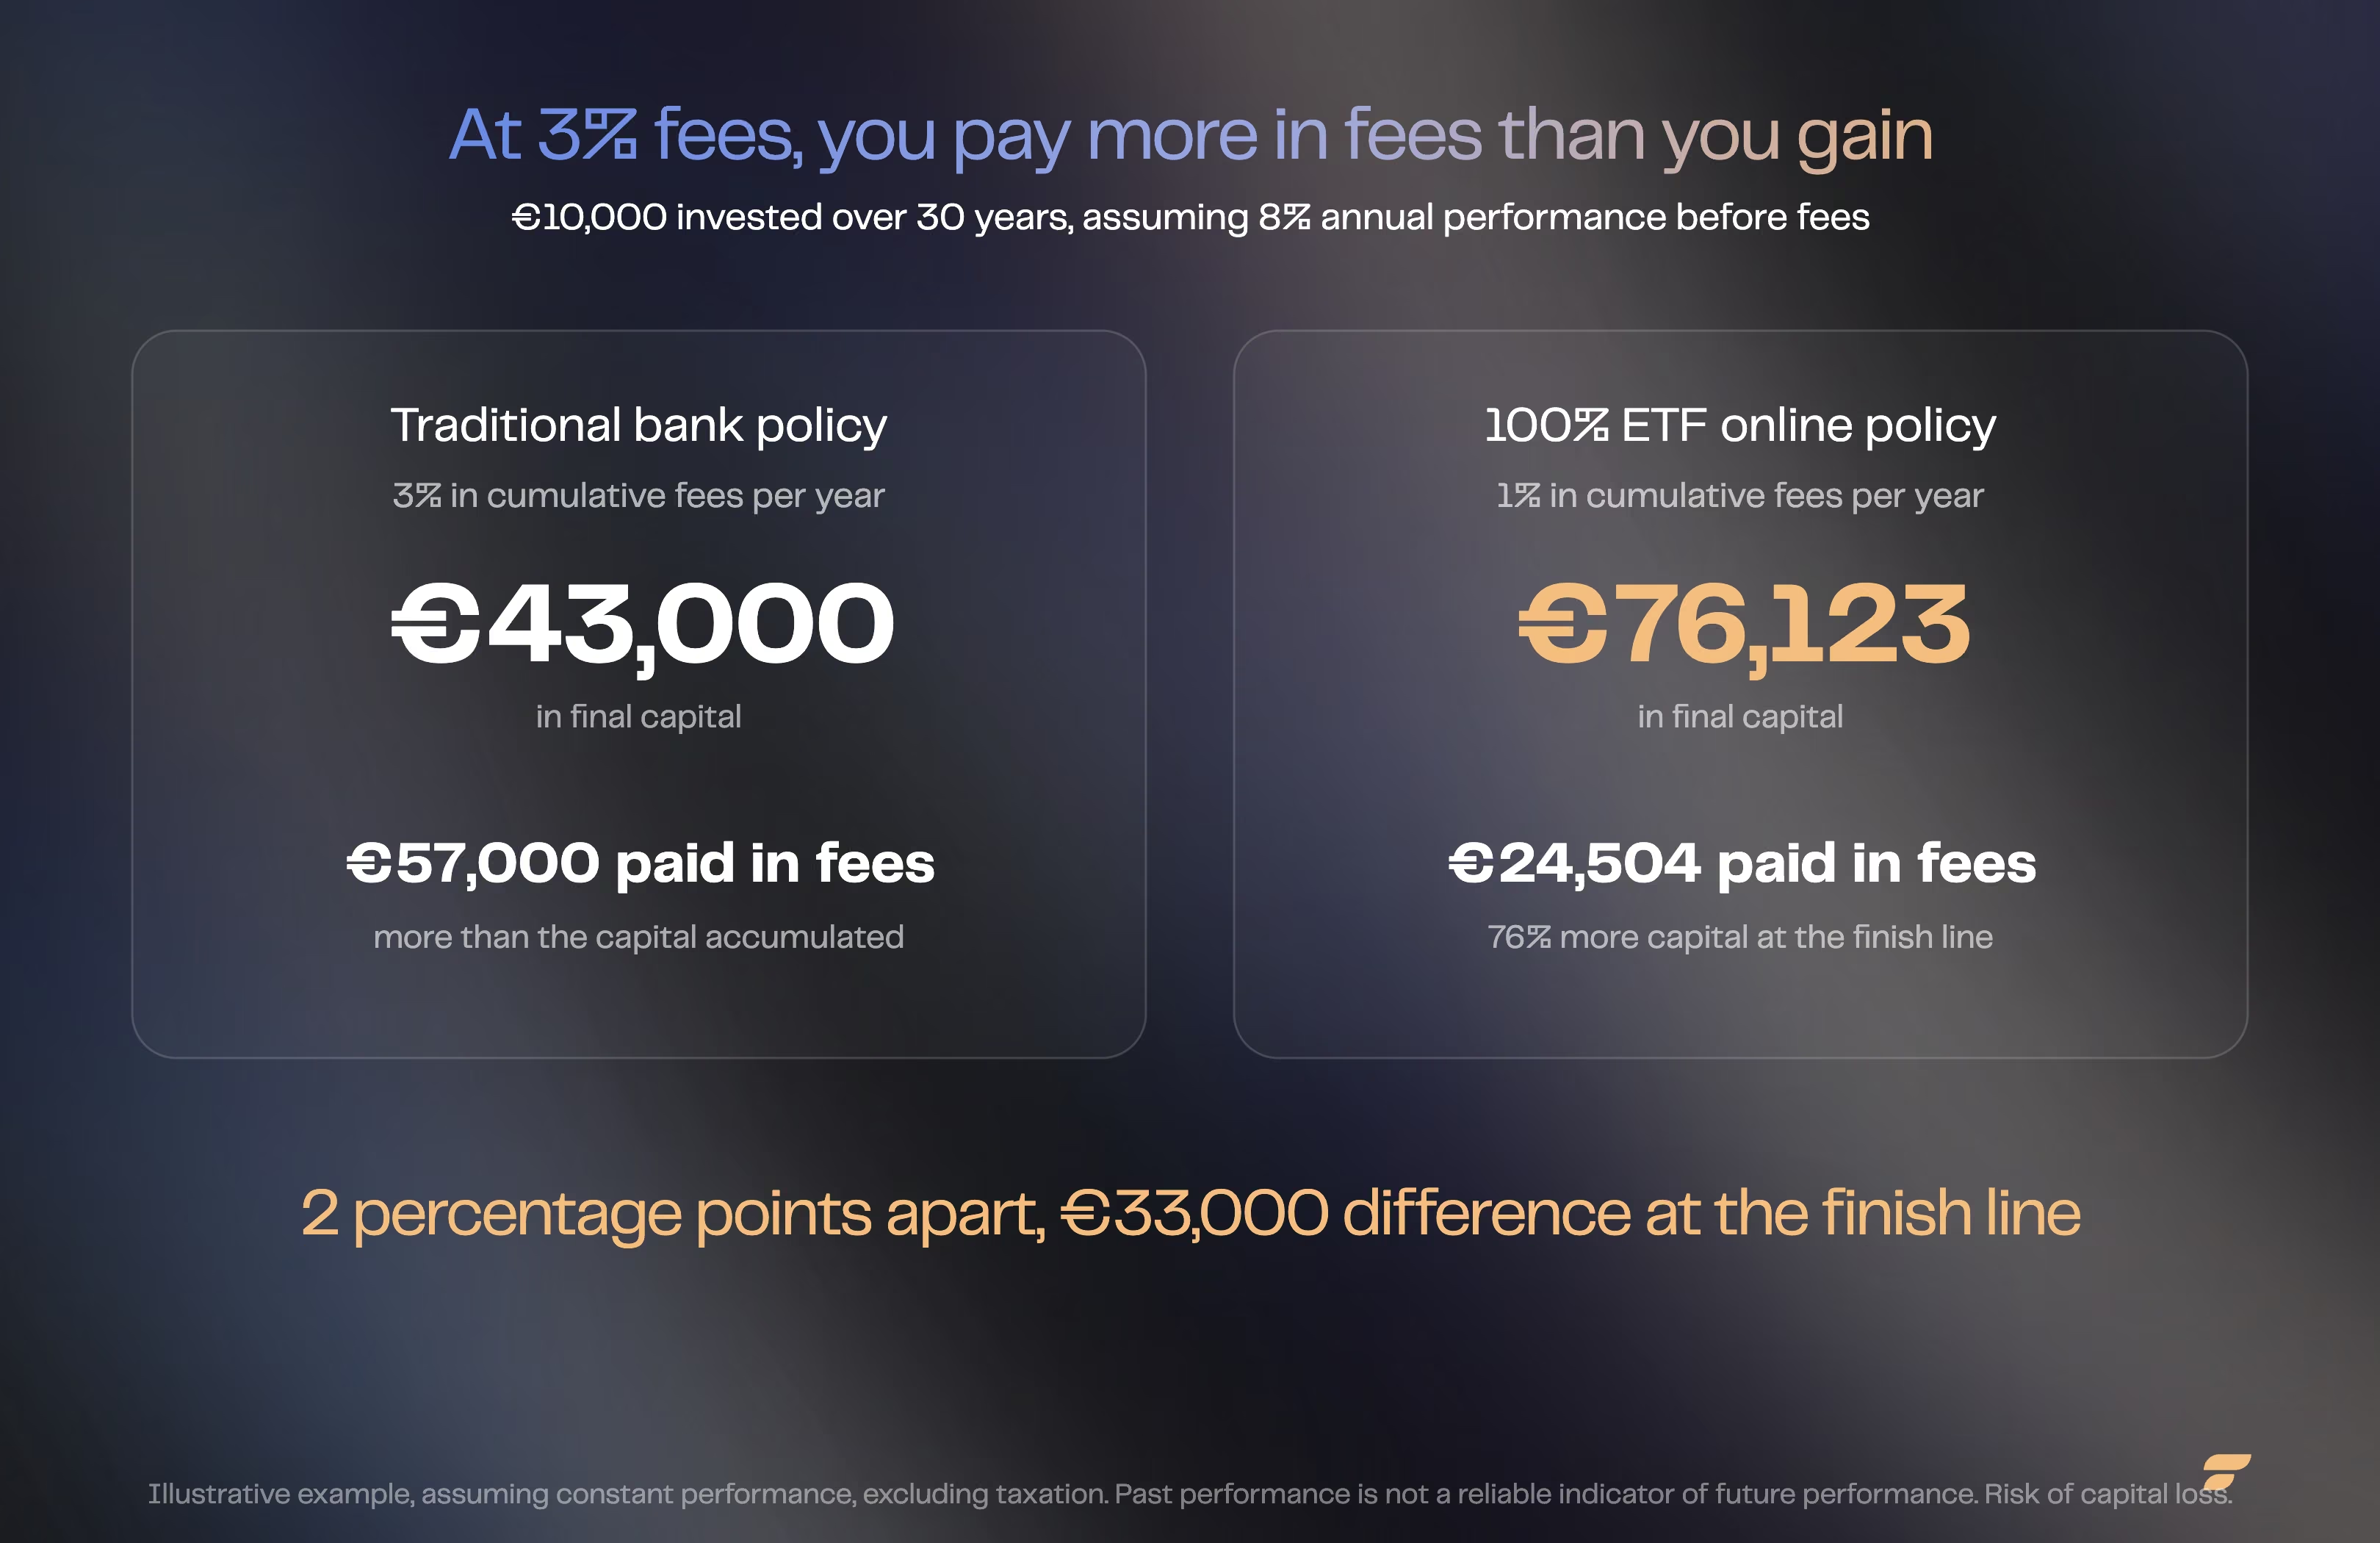
With the 1%-fee online policy, at the same performance, you end up with €76,123, having still paid €24,504 in fees (24.35% of the performance). That is 76% more capital at the finish line.
Two clarifications. First, many online providers offer ETFs but charge for a managed-portfolio service: an overall cost of around 1.6%, twice as expensive as 100% ETF self-directed management. Second, the example applies to life insurance, but the mechanics are identical for a PEA, a PER or a securities account.

How to reduce your investment fees
Here are seven levers, from the simplest to the most structural.
1. Scan your portfolio. Finary's fee scanner automatically detects the fees on your policies (connected or added via their ISIN codes, the unique identifiers for funds) and projects their long-term impact.
2. Learn to read performance. Be wary of performance expressed in absolute terms: the only figure that matters is performance relative to the benchmark index. Making +7% when the index makes +9% is underperformance.
3. Switch your active funds into ETFs. For equivalent exposure, the TER often drops from 2% to under 0.5%. To get started, see our guide on how to invest in the stock market.
4. Consider self-directed management over a managed-portfolio service. Delegating comes at a cost that weighs on performance. Dollar-cost averaging (DCA) into a diversified ETF allocation can save you a lot.
5. Transfer your expensive policies to an online provider. Note: for life insurance, transferring without losing tax seniority is only possible within the same insurer. The PEA and the PER, on the other hand, are transferable between institutions. Our benchmarks on life insurance fees can help you see where your policy stands.
6. Do not be afraid to close a bad policy. Seniority and the tax advantage are very often wiped out by the sheer weight of fees.
7. Understand how your advisor is paid. Most advice is paid for on commission by the product provider, not by the client. A study by researchers at the University of Regensburg compares countries where advice is fee-based with countries, like France, where commissions dominate: with a return gap of around 1.7 percentage points, a household starting with €100,000 and saving €1,200 a year ends up, after 40 years, with around 84% more wealth in countries without commissions.

Frequently asked questions
What are the main fees when you invest?
Three layers stack up: wrapper fees (contribution, switching, account maintenance, exit), investment-option fees (the TER of funds and ETFs, deducted from the value of your units) and managed-portfolio fees. Transaction fees are added on top of every purchase or sale.
What is a fund's TER?
The Total Expense Ratio, or ongoing charges: the annual fees of a fund or an ETF, deducted directly from the value of its units, which makes them easy to miss. Expect roughly 1.5% to 3% for an active fund, versus 0.1% to 0.5% for an ETF.
Why do ETFs cost less than active funds?
Because they simply replicate their index, with no active management team to pay. According to the SPIVA study, more than 80% of active managers fail to beat their index over more than 5 years. Past performance is not a reliable indicator of future performance.
How can you find out the fees on your policy?
They appear on the provider's website and in your policy documents, and your advisor is legally required to disclose them, under the European MiFID II directive on markets in financial instruments. Ask for the full breakdown: wrapper, investment options, management and transaction.
Can you transfer your life insurance policy to pay lower fees?
Transferring without losing tax seniority is only possible within the same insurer: switching provider is an uphill battle. The PEA and the PER, however, are transferable between institutions. Closing a bad, overly expensive policy is sometimes still the best option.
Sources
University of Regensburg, study on the impact of commissions on household wealth
AMF, understanding and learning about the fees on financial investments
AMF, financial investments and MiFID II: greater transparency and investor protection for savers
Regulatory disclaimers: Marketing communication. Investing carries a risk of partial or total capital loss. Past performance is not a reliable indicator of future performance. This article is provided for information and educational purposes only; it does not constitute personalised investment advice, a buy or sell recommendation, or tax advice. Before investing, read the Key Information Document (KID) and, where relevant, consult an authorised adviser. Finary SAS, an investment firm authorised by the ACPR (no. 19283), member of AMAFI. Insurance broker registered with ORIAS (no. 21001279), member of the CNCGP (association approved by the AMF). Crypto-Asset Service Provider (CASP) authorised by the AMF under the MiCA regime, references no. A2026-026 and no. N2026-008.